Models based on fixed cycles: playing around
upgrade April 22, 2005
written by Sergey Tarassov
Introduction
Technique
Parameters to vary
Usage this technique for intraday data (added April 25)
This article is devoted to the forecasting model based on fixed cycles. The most appealing features of this model are:
This model is based on fixed cycles. But, comparing to the standard approach, this technique allows you to observe details formed by each cycle.
This model allows to model the inversion phenomena - when the stock market is beginning to move in the opposite manner within the same cycle starting from some particular moment in time.
You do not need extensive price history data to create this model. I recommend to use 4 years price history. More history data (like 10 years) slow down this technique significantly while the short history data make the resulting curve more jumping.
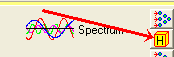
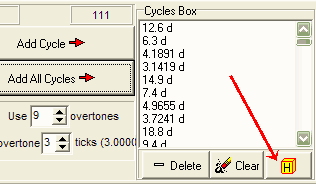
To create this model you need just one mouse click. When you have downloaded the upgrade of April 22, 2005, you will find there a new button:
Click on this button. In a moment, you will get this window:
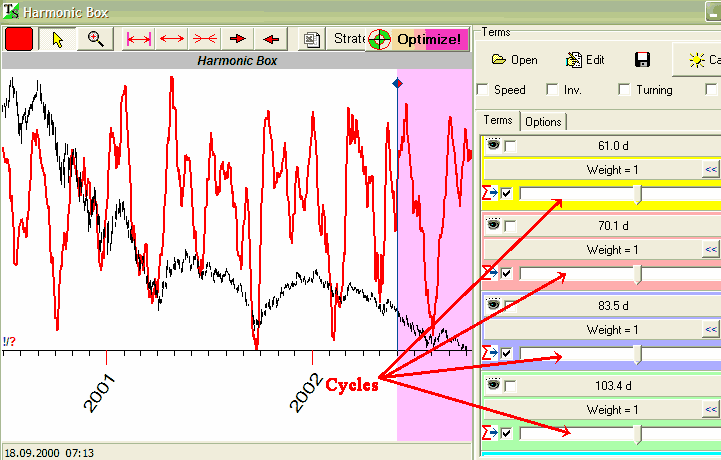
What does the program do? It runs the spectrum module, extracts the most influent fixed cycles that appear within this price history data, and then creates the model based on these cycles. In the example above, the program has extracted 20 cycles. For each cycle, you see a special slide panel in the right side of this window. Dragging the slides, you can vary the force of each cycle. At the same time, you are able to observe how the final projection line is changing in respect to these slide's movements. In other words, playing with the slides, you change the coefficient of the importance for each cycle in the price movements of your market. Thus you can see easily the possible ways of the price movement regarding to each cycle.
Select some piece of price data from the red (i.e., testing) interval. Let us try to understand how really this model predicts the future price movement. (Reminder: To calculate this projection line and these cycles, we do not use the price points from the testing interval, the future leaks are excluded in this program).
I recommend to follow three steps while making the forecast:
Step1 - Specifying the dominant cycle: First of all,
find the cycle that is dominating in this period. When we have more than one
cycle inside some data, the cycles behave similar to people in the group. Though
each one of the members of the group is a unique human being, with his/her
unique features, habits, knowledge, power, etc., they do not demonstrate all
these abilities in the group. As the group members, they have different
functions in it. And there always is a leader - otherwise the group will cease
to exist. The leader may be different in different circumstances, like one
person is leading in one activity, while the other may be leading in something
else. The same with the cycles. Between all of them, playing at some time
period, one is dominating. It may be dominating for the whole period, and it may
transfer its role to other/others down the road. This idea may be an explanation
how and why bullish market turns to bearish from time to time, and vice versa.
Enough general discussion, let's go back to the model. You can make any playing cycle visible checking the "eye" option:
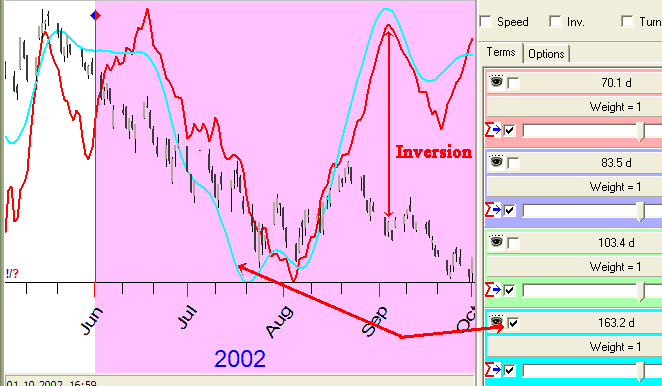
In this particular example, you can see that 163.2 days cycle is the most influent from July 2002 up to the middle of August 2002. Does it ring the bell for you? For me, it is not surprising: it is very close to a half of 320 days cycle that appears very often in different price data (equity, commodities, indexes - see here: http://www.timingsolution.com/TS/Study/Coffee/coffee.htm ).
Step 2 - Specifying inversion phenomena: Look at the same example. You see that, starting from the middle of August, the projection line and the actual price move in an opposite manner. For the whole month, the projection line was like a mirror of the price. We can take this inversion as a fact of changing the stock market's structure; some cycle starts working here in an opposite way. Another possibility is an intervention of some fundamental factor. Here we will follow the first possibility - the cycle working in the opposite way than it has done earlier (the fundamental factors and their influence are in our list of research). You can see that the top for the projection line in the beginning of September 2002 corresponds to the bottom turning points for the price.
Can we find out what cycle of these 20 is playing this way? Let us try.
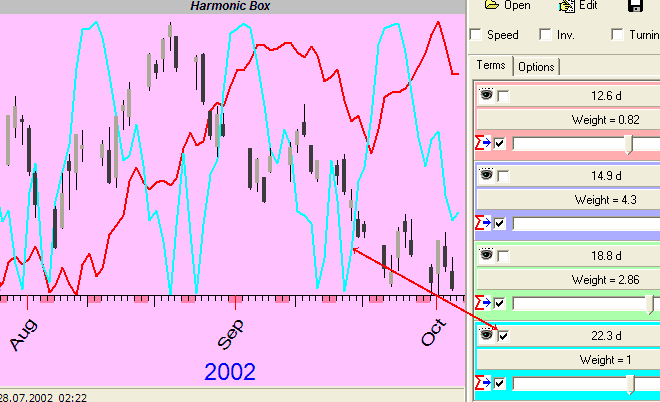
Picking up all cycles one by one, I have found that the most probable candidate is 22.3 days cycle. This cycle produces the turning point of the projection line in the beginning of September and looks like is starts working in the "inversion mode" from the middle of August. To confirm our finding, we do the step 3.
Step 3 - Manually modeling the inversion phenomena: Dragging the slide that corresponds to this cycle, we can change the force of this cycle. Dragging it to the left, we make the weight for this cycle negative. Thus, we are modeling the inversion (i.e., opposite movement) for this cycle. The small red mark in the left side indicates the inversion:
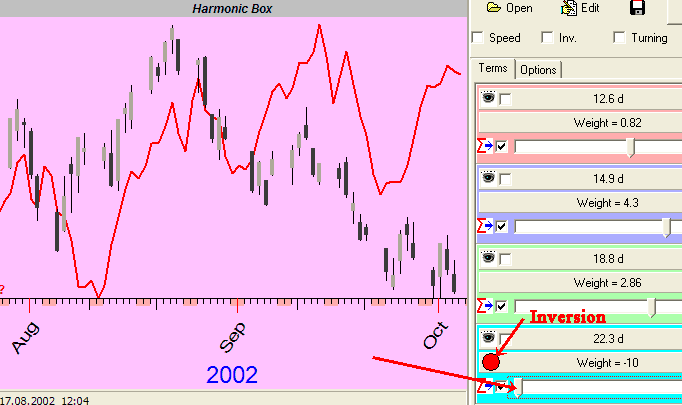
Now we can see the projection line with inverted 22.3 days cycle that explains September price movement better than the regular model.
If you want, you may vary the parameters for the Spectrum module and run the same model through the Spectrum module:
By the way, I recommend to use "Speed" option for this model:
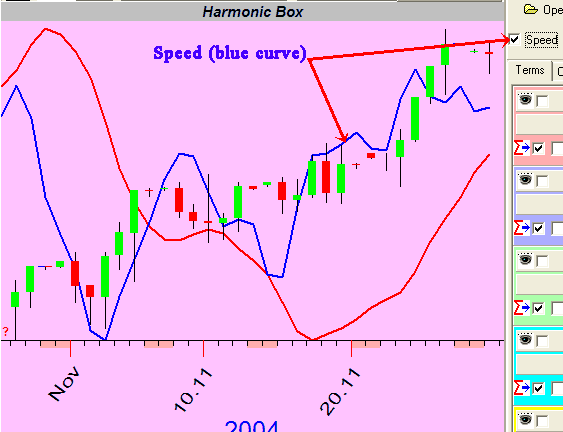
It is a derivative of the projection line. Sometimes the price follows the speed curve (the blue line on the picture) rather than the projection line.
For this model, I recommend to vary these parameters of the Spectrum module:
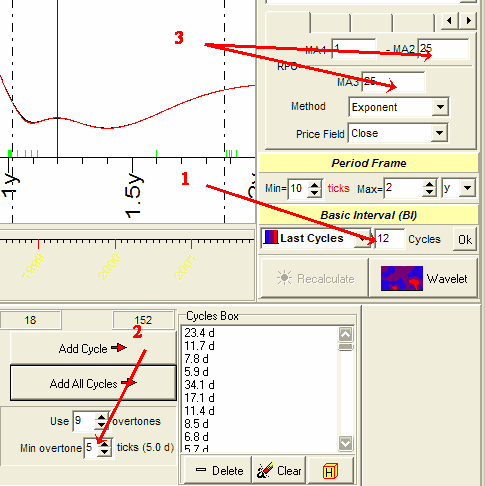
The Basic Interval. Try do decrease it (like 5.0). This approach reveal much more information for the short term cycles.
Min overtone cycle period. I recommend to use 5 ticks, the usage of shorter overtones (like 3 ticks) makes the projection curve more jumpy.
Parameters for oscillator.
How to apply this technique for intraday data
The following is a description of necessary steps to get a fixed cycles based forecast for intraday data:
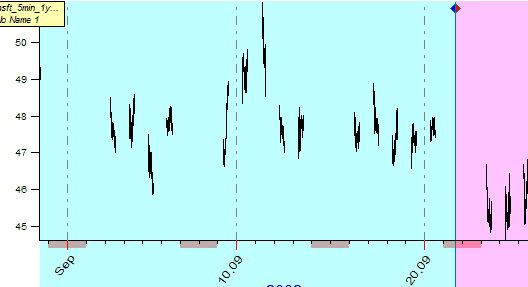
Step 1. Download the price history data. But do not use the long history. I used to use 14 days for the model's training and 3 days for its testing. In other words, about a month of data is well enough.
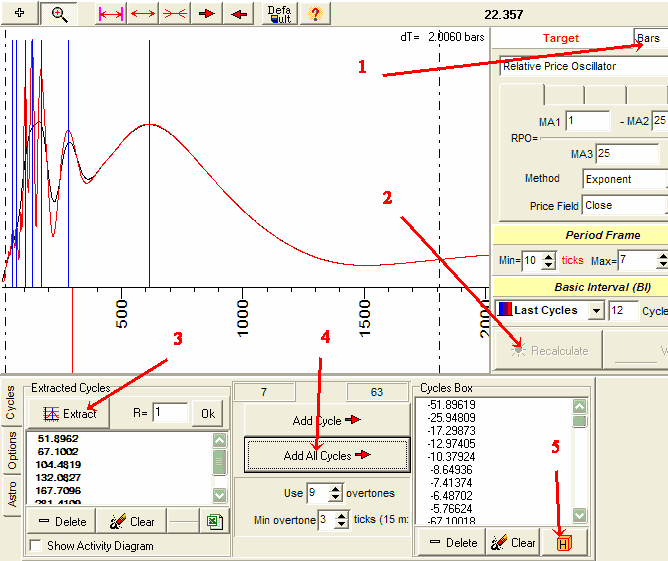
Step 2. Run the Spectrum module. But - to calculate the Spectrum, use "Bars" basis, not "Time". Do these operations:
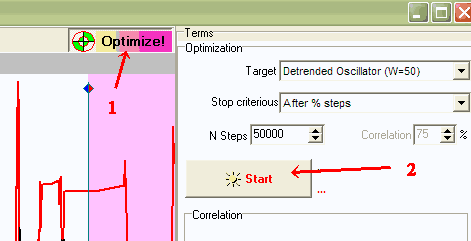
Step 3. Optimize this model to get the forecast. Click on these buttons:
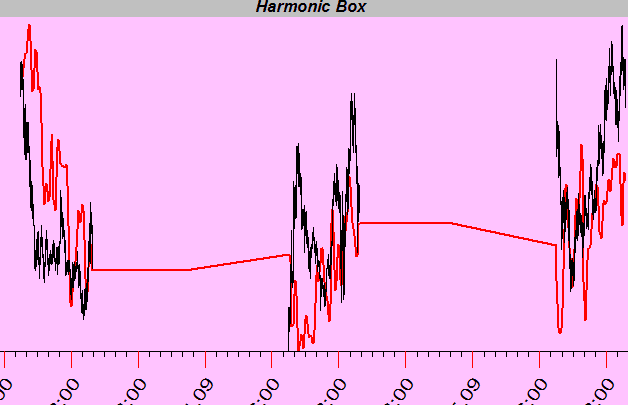
After 10,000 steps of optimization, I have got this projection line on TESTING (red) interval. It is not bad! At least, we can see the tendency for intraday movement:
The usage of the bigger price history makes the projection line worse.
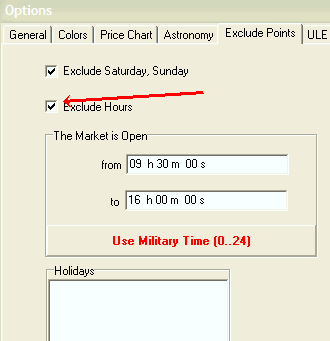
When working with intraday do not forget to exclude non trade days in "Options" window:
22 April 2005
Toronto, Canada.