Turning Points Analyzer (TPA)
The main idea of this module is finding the price levels where the price movement changes its trend. To do that, we create the zigzag and look for these levels by analyzing different proportions of zigzag swings. Actually, this idea is very close to Elliot Wave Theory, but our goal is to provide the universal tool that allows to reveal hidden patterns in zigzag.
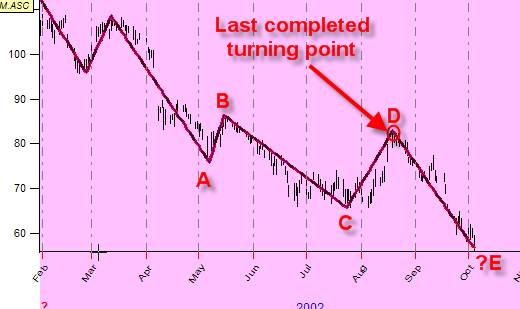
Let's consider the zigzag created for IBM shares. This picture shows 8 months interval:
Here you see that the turning point D is the last known turning point. This is TOP turning point, so we are looking for the end of downtrend movement. We need to know the height of D-E swing. In technical analysis the D-E swing is called a retracement. Our target is to find the height of this retracement swing to anticipate the next Bottom turning point E.
The simplest approach to find the length of down D-E swing is to analyze the proportion between all preceding up and down swings using all available price history and performing the statistical analysis for these proportions. If we know the most probable proportion, we can find the height of D-E down swing using the height of previous C-D up swing.
Now, let us do it together. After downloading the price history data, hit this button:
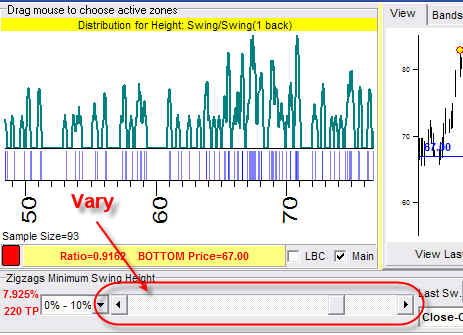
You will immediately get this screen:
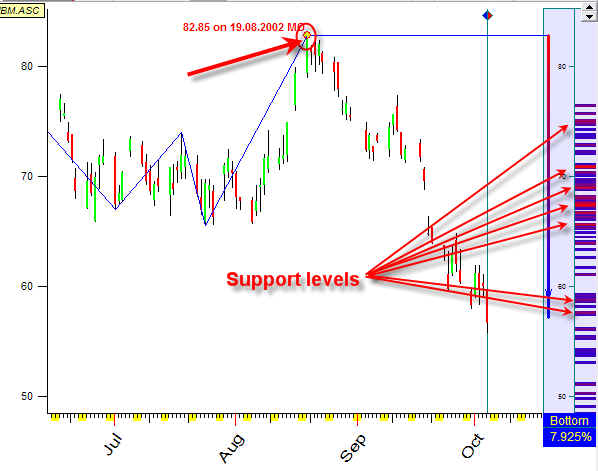
Pay attention to two subjects here:
a) last tuning point August 19, 2002 is top, it means that we
are looking for the bottom turning point;
b) the colored stripes in the right part of the screen correspond to the most
probable levels where the price can change its trend from the statistics point
of view.
The red stripes correspond to the more probable levels, while the blue ones - to the less probable.
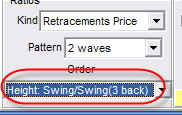
The first parameter that I recommend to vary is the critical zigzag height:
The program automatically recalculates statistical criteria and updates the Main screen, Thus you can observe all possible support levels very quickly, though always watch the last turning point, whether it is a top (and we are looking for the next bottom) or a bottom (looking for the top).
Next important option is "Force":
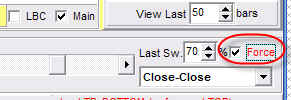
Set it "ON", and you will get this:
What does the program do? It sets the last completed turning point as a bottom (September 30, 2002) and conducts the research looking for the next top. Formally the point Sep. 30, 2002 is not a bottom because we have enough uptrend movement to confirm it. We set this point manually: "If Sep. 30, 2002 is a bottom, what would be the most probable level for the top?".
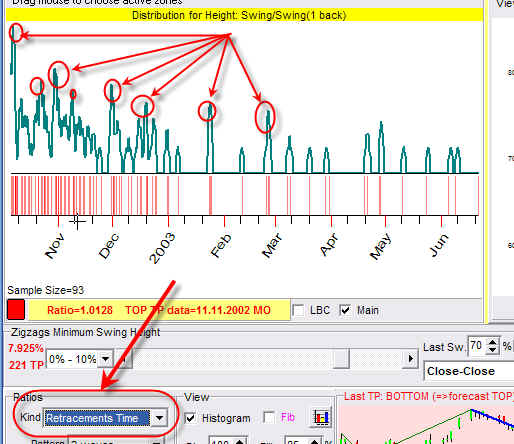
As a variation you can research time intervals between turning points and find the most probable dates for them:
You can also analyze more complicated schemes, like research proportions between down swing D-E and up swing A-B (not swing C-D):
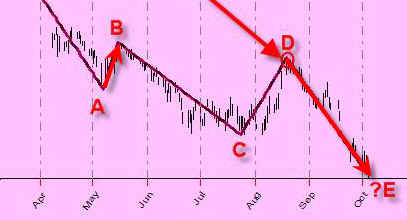
Use this option for this purpose: