Downloading price chart, screen manipulations, worksheets, updating price history, real time
Before making any forecast, you need to decide what you would like to forecast. And you need to find the data for your financial instrument. It is your responsibility to find the data that will be used for your forecast. Together with the program, you will get the price history files only for some financial instruments. They are helpful while you are learning how to use the program. However, for a better forecast, you need a source of the most recent data. You may get this info as some file, or from some data feed source, or you may use Yahoo data.
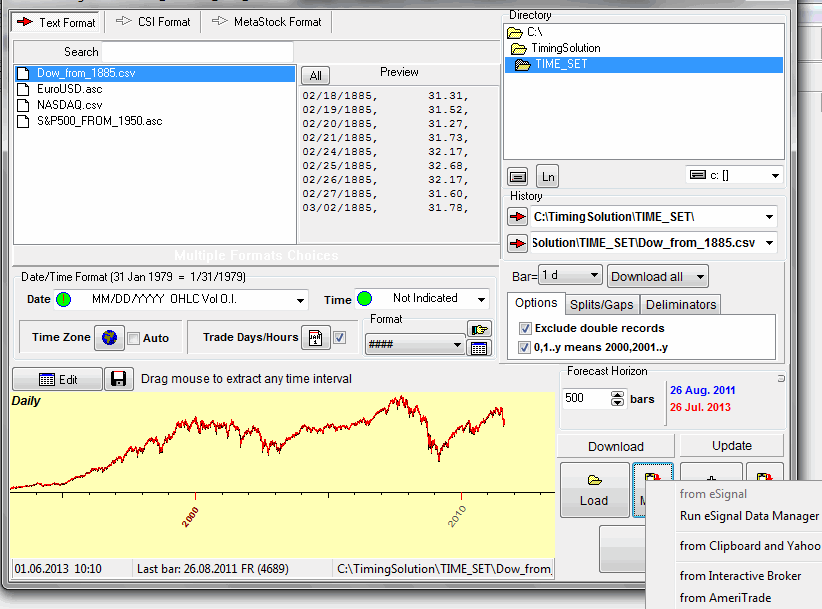
The program supports more than 1000 different text formats, Metastock and CSI formats. Also you can download the price data from Yahoo financial service, e-Signal, Interactive Brokers, Ameritrade (you can do that if you are signed to those services)..
To download the price history from some previously saved file, click this button:
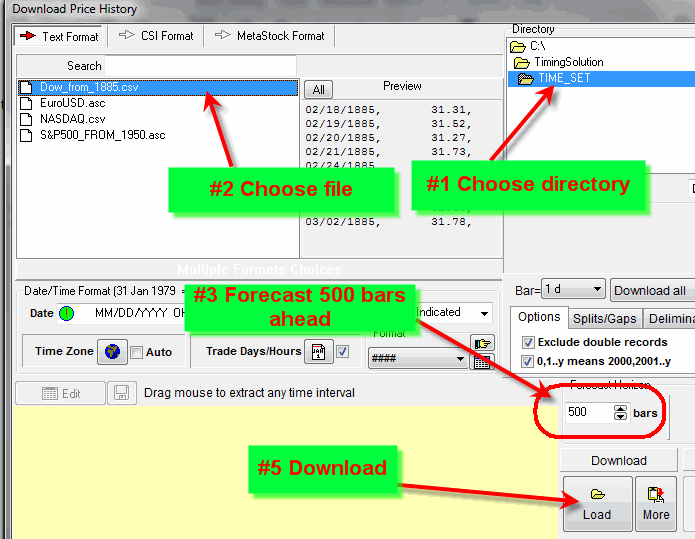
And follow these steps to download the price history from your text file:
Downloading data from some text files and Metastock files
You need to choose the directory where this file is located, highlight the file and click "Load" button. Also define the forecast horizon, i.e., the length of your forecast.
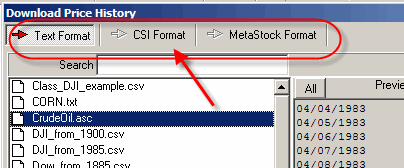
To download Metastock data, use these tabs:
eSignal, Yahoo, Interactive Brokers, Ameritrade
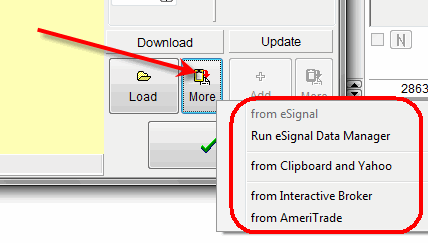
To download the price history from eSignal, Yahoo financial service, Interactive Brokers and Ameritrade systems click "More" button. You will get this menu:
How to download the price history through Yahoo service?
If you are downloading the price history from free Yahoo financial service, follow these steps:
a) choose this option:
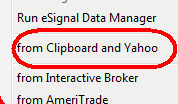
b) run Yahoo service:
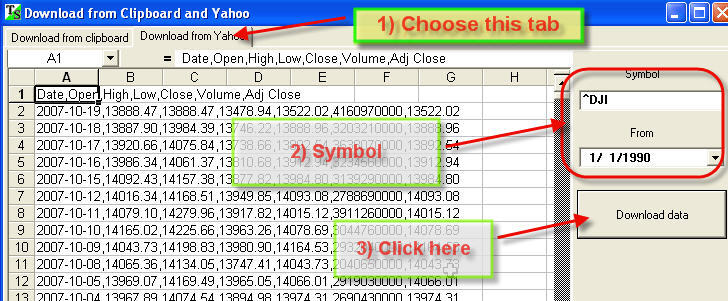
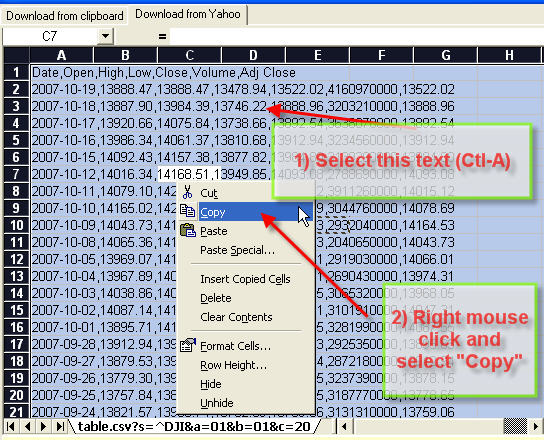
c) put the content of this table into the clipboard:
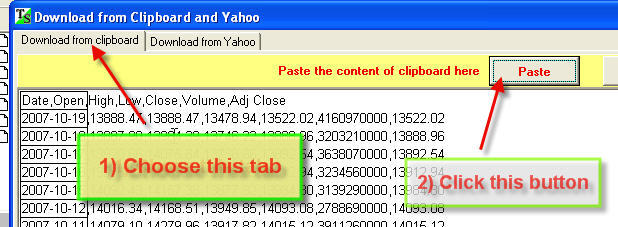
d) download the price history from the clipboard:
Do not forget to define the exchange location
When you click "Load" button, this dialog box will appear on the display:
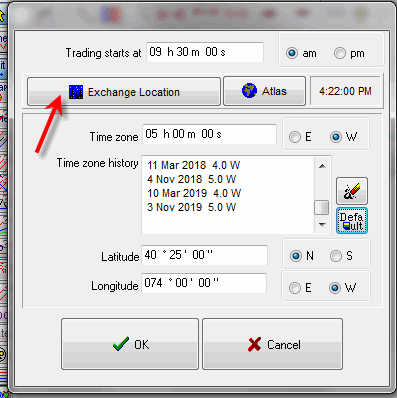
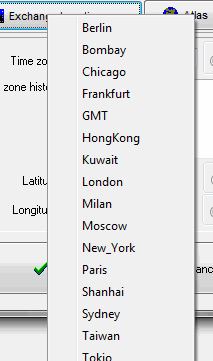
If you are downloading daily data, it is necessary to input the time when trading begins. Also for astronomical calculations you need to define the exchange location. To do that, click "Exchange location" button and you will get the list of available exchanges:
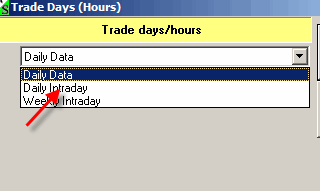
Daily and intraday data
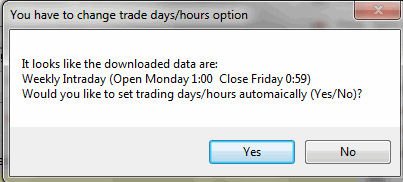
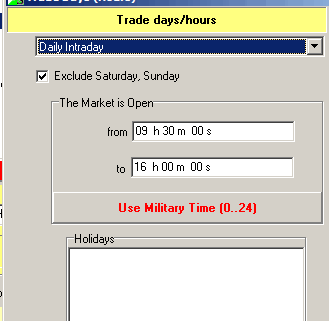
If you are using intraday data, you need to set trading hours; this information is necessary to generate the projection line. In most cases the program specifies the type of downloaded price history data; you will see this notification window with the information about data:
You can set this data manually as well. Click on this button:
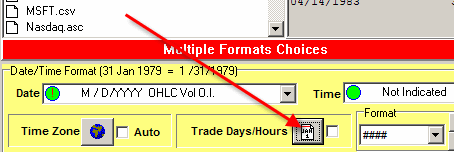
Choose the kind of intraday data (daily or weekly intraday):
And set trading hours here:
Updating price history
Remember that you can update your price history using these buttons:
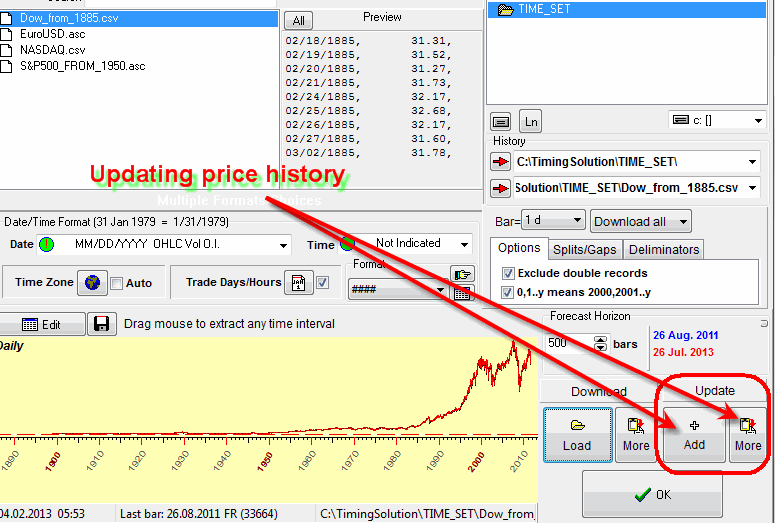
It is possible to update through the file, e-Signal, Interactive Brokers, Yahoo, AmeriTrade. The program simply appends additional price history to the existing chart. Thus you can combine the price history using several sources of data.
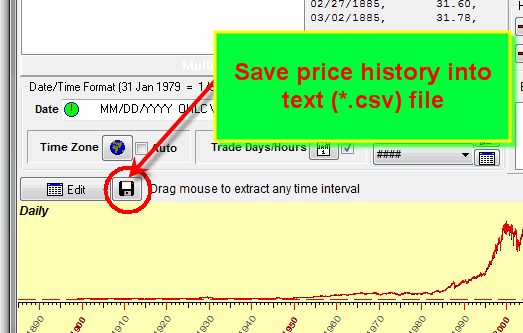
Also clicking the button shown below, you can save the downloaded price history into some text file:
Price chart manipulations
When the price history is downloaded, you can do any screen manipulations with your price chart.
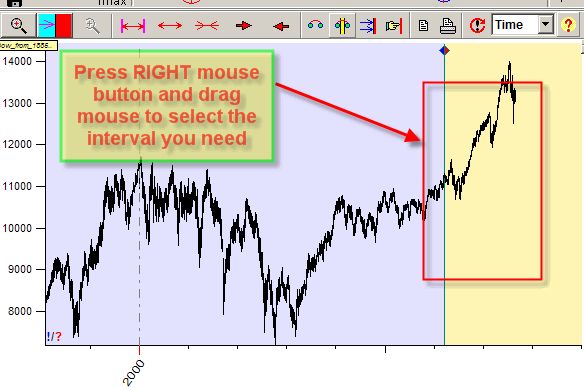
For example if you need to view not all price chart but its small part with the details, do this:
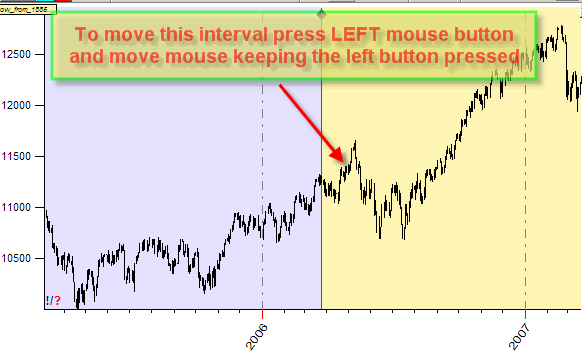
To move this interval to see the price history prior/after selected interval, do this:
Also you can use these buttons to manipulate the viewed interval:
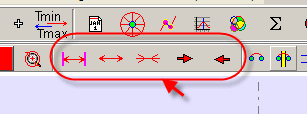
Move the mouse to any of these buttons. You will see there what this button is for.
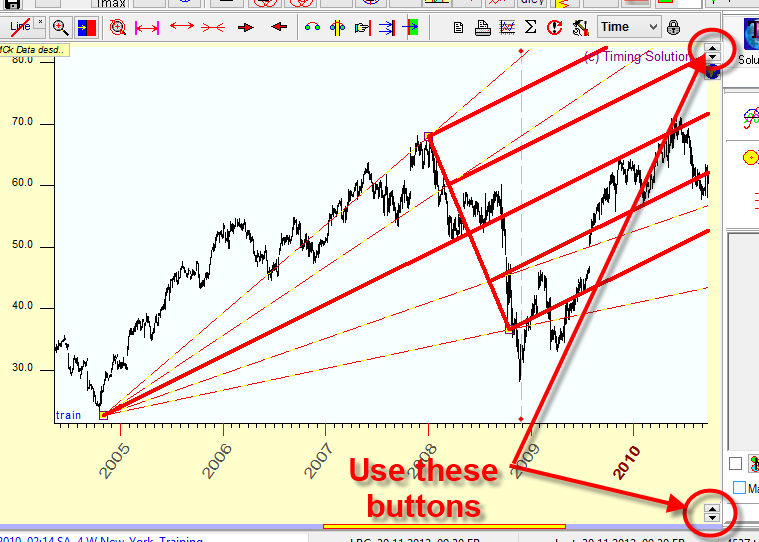
Margins
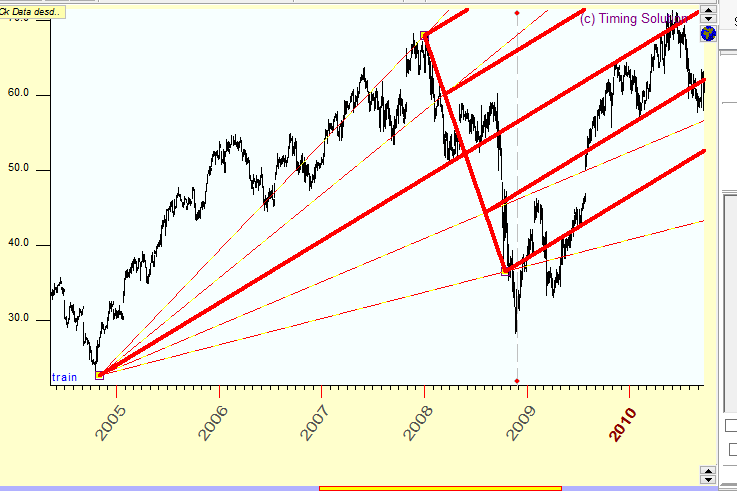
Sometimes while drawing a charting tool we need more room to display the price chart, As an example, look at the picture below. Here, to display this pitchfork, we need to display the price chart using the price range $20-$80 while the program automatically uses more tight range, $20-$70:
In order to increase this range, use these buttons:
Splits
When downloading the price history, take care of the splits. They look like gaps on the price chart:
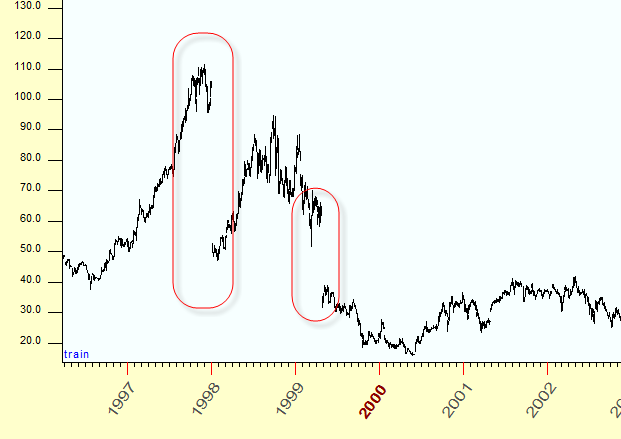
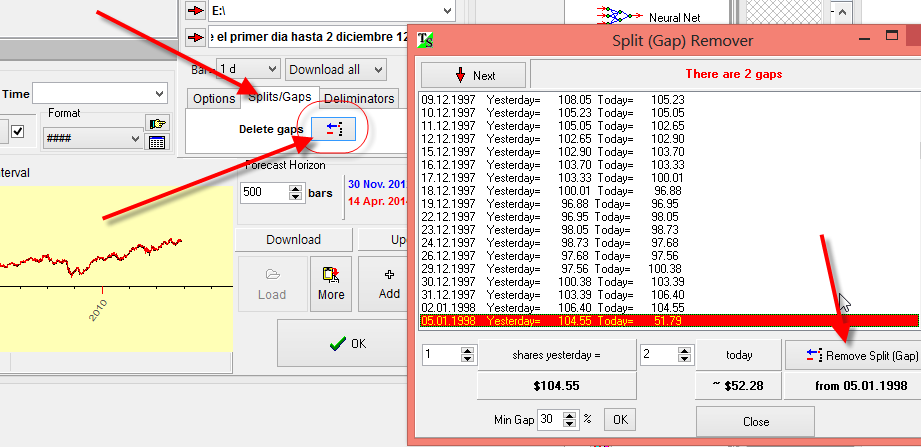
Here the gap in the beginning of 1998 corresponds to the split $100 => 2 x $50. We recommend to adjust the price history removing these splits this way:
Technical analysis indicators
To create the classical indicators of Technical analysis (like moving averages, RSI, MACD), use these buttons:
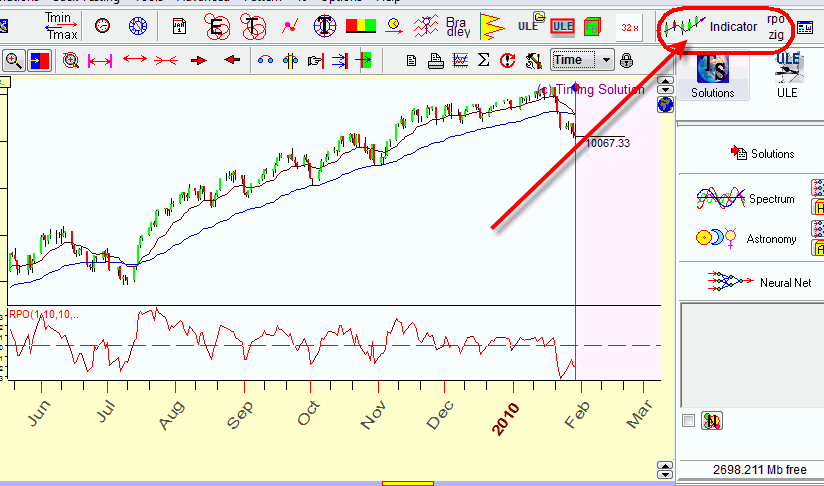
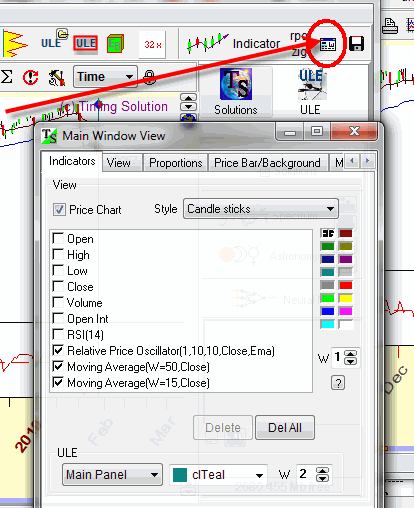
There you will find a list of available indicators. To modify the view of these indicators (like color, thickness) or to remove them, use "Main Window view" module clicking this button:
Charting tools
You can start your analysis with simplest charting tools - such as trend lines, Andrews pitchfork, Fibonacci levels, Gann fans etc. Timing Solution gives you a great variety of charting tools. Moreover, we provide new charting tools, or "smart" charting tools that are quite simple in use while having complicated math behind. You can read more about this issue here: http://www.timingsolution.com/TS/Study/ts_charting_tools/index.htm
To draw any charting tool, follow these steps:
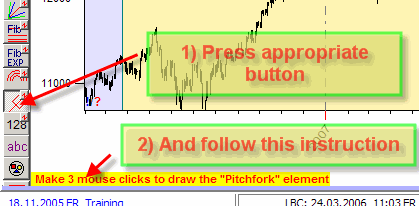
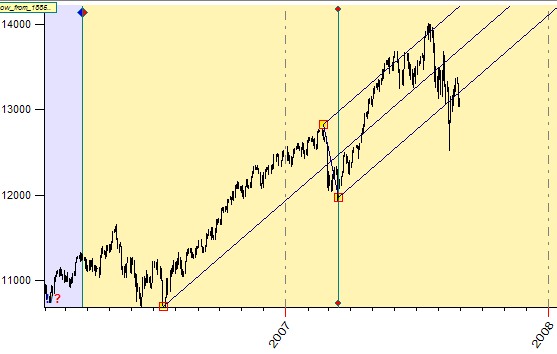
This is a sample of Andrews pitchfork:
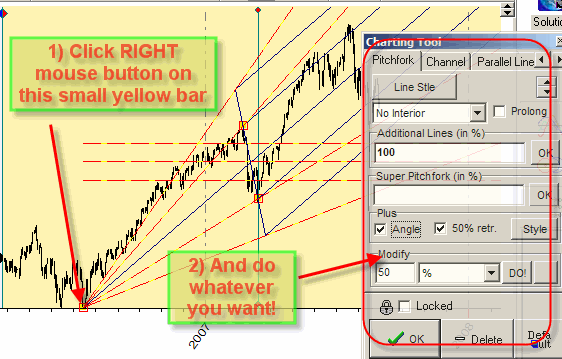
You can modify this pitchfork this way:
Timing Solution worksheet
When working with Timing Solution, usually you apply many techniques. Look at the chart below, you can see there the typical desktop with the price chart, two charting tools (Pitchfork and Fibonacci level), Annual cycle and Easy Expert module that shows the statistically verified effect of some astronomical phenomena:
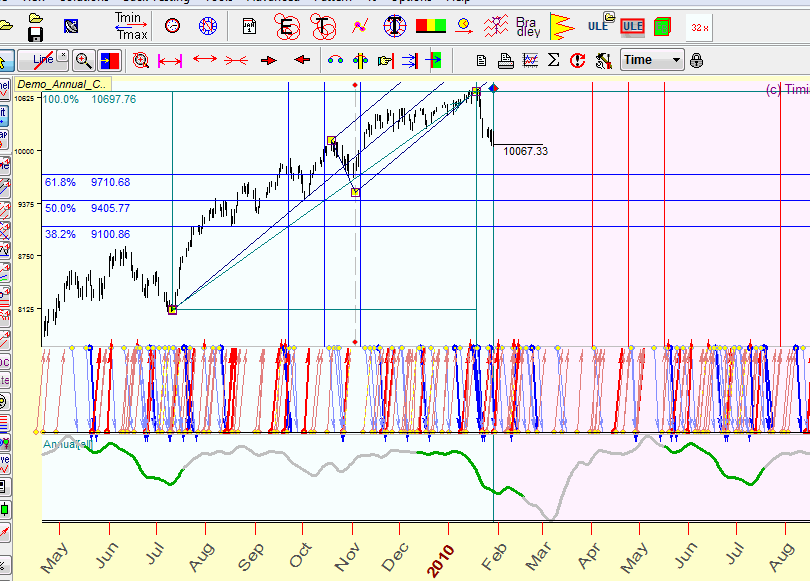
You have spent some time organizing this worksheet. Do you have to spend that same amount time whenever you would like to use the same set of techniques? Timing Solution is able to help you here.
You can save and restore your work later clicking these buttons:
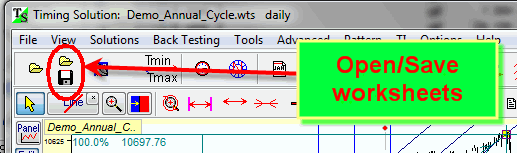
Thus you do not need repeating your actions next time you run Timing Solution; you will be able to get back to your chart any time.
Updating price history through a worksheet
When you save your worksheet, do not forget to set the regime how the price history should be updated:
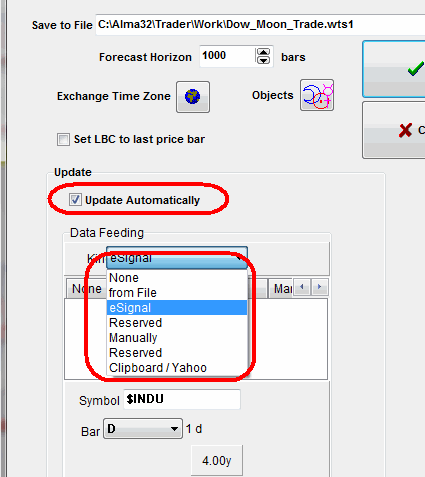
There are several possibilities there:
Real Time streaming
This issue is explained here: http://www.timingsolution.com/TS/DF/