Forecast based on astronomical cycles
Composite astro cycles
The models applied in this forecast are based on the assumption that planetary positions or angles between the planets are somehow related to the stock market movements. I would not say that the market moves because of the Sun in Libra or because of the Mercury - Mars trine. We do not know yet how the links between the planets and the market actually work. However, we can state that some connection exists between market's ups and downs and the mutual disposition of the planets in the sky above. The statistics is behind this statement.
However, it is a subject for the scientists to explore. For us, it is enough to know that there is a connection, and we can work with it. So, we can use it for our forecast.
Download any daily price history and click this button:
You will get something like this:
These curves show the averaged price movement while the Sun is passing through different Zodiac signs. There is no mystic here, it is a natural cycle that we all know too well. In other words, this is the Annual cycle. This is not the exact forecast, these curves show only a tendency, the most typical movements. You can see here September drop (when the Sun passes Scorpio sign), Christmas rally (the Sun leaves Scorpio and passes through Sagittarius):
Now look at the Main screen:
This green curve shows how the Annual cycle works in time. To display this curve together with the price chart (instead of each one of them on a separate panel), click this button:

Similarly you can work with any astronomical cycle. As an example, analyze the angle between the Moon and the Sun, i.e. the Moon phase cycle:
This is how the composite diagram for the Moon phases looks:
It shows that in average the price (DJIA is analyzed) reaches its high around the New Moon, then it goes down till the moment when the Moon - the Sun angle separation reaches 290 degrees (i.e. one week before the next New Moon), and after that it moves up till the next New Moon. This information can serve as a base for the forecast. On the Main screen you can see how the Moon phases cycle works in time:
It is possible to use different Zodiacs (why not? they are nothing else but different coordinate systems where we can observe the same planetary movement). See the cycle generated by a heliocentric position of Mercury:
"Mercury-Mercury" here means that the position of Mercury is being analyzed. Thus you can see how Mercury heliocentric cycle works (this is approximately 88 days cycle):
When you change the planets/Zodiacs, the program redraws the projection line automatically; you pick up any cycle, and the program updates the projection line.
The main rule - the sufficient amount of price history
While working with astro cycles, you should always keep in mind the period of analyzed astro cycles. Please pay attention to this information line in the Composite module:
In this particular case it shows the period of analyzed cycle (Mercury heliocentric 88 days cycle) and the amount of full cycles that this cycle has made within the analyzed period. Here 32 years of price history data has been downloaded. Within this time span, Mercury has made 131 full cycles around the Sun.
The rule is: to analyze any cycle you should have 3 x Period of price history data at least, better more. For example, analyzing the Annual cycle you should download 3 X 1 year=3 years of price history data at least.
In the example above we have enough price history (131 full cycles) to work with Mercury astro cycle. Let's consider another example below. We have downloaded 20 years of price history data and we would like to work with Jupiter cycle:
The period of Jupiter cycle is almost 12 years. According to the rule, the minimum amount of price history that we need for the calculation of this cycle is 3x12 = 36 years, i.e. 20 years is not enough (this period covers only 1.68 of full Jupiter cycle).
How to pick up the most important astro cycles
To pick up astro cycles we recommend to use these criteria:
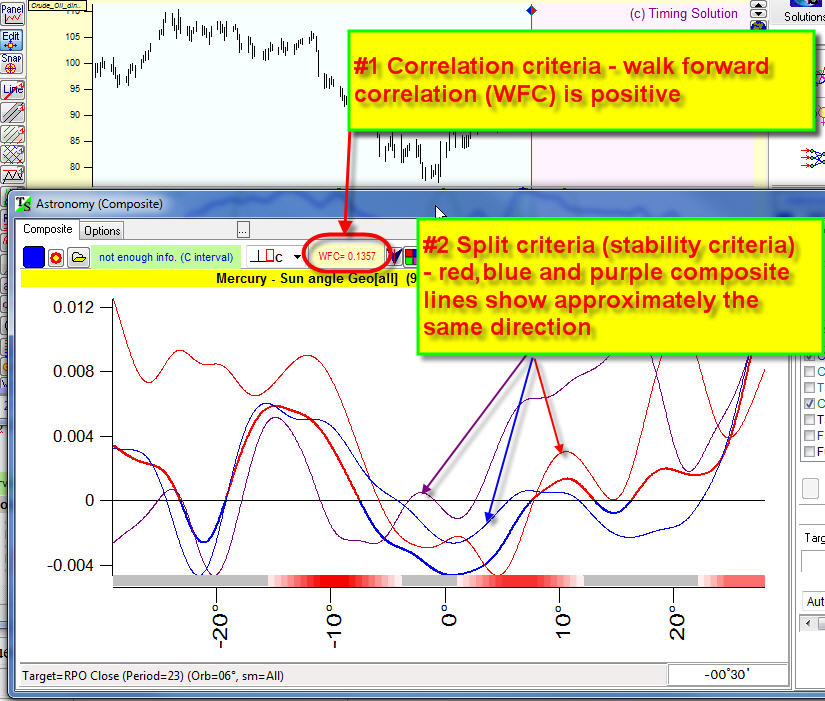
These criteria should MEET TOGETHER, i.e. walk forward correlation should be positive. It is displayed here:
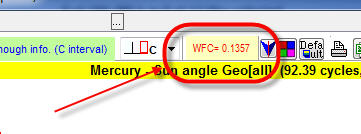
If the correlation is positive, it uses red font, if negative it uses blue font:

Split criteria - these criteria allow to reveal stable cycles, it is explained here http://www.timingsolution.com/TS/Study/Classes/class_comp_2.htm
The most important astro cycles
Practice shows that these cycles are the most important:
- Annual cycle
- Moon cycle - we recommend to check three variants of the Moon cycle:
Moon tropical cycle (works for indexes), period is 27.3 days:
Moon phases cycle (works for gold), period is 29.5 days:
Moon Draconic cycle (works for Forex), period is 24.44 days:
- Planetary phases. Very often the phases of inner planets (Mercury and Venus) are important for the stock market. Here they are:
Mercury phases (period is 116 days):
Pay attention, Mercury phase is the angle between Mercury and the Earth in heliocentric system (in heliocentric system we use the Sun glyph to designate the Earth).
Venus phase cycle (period is 584 days):
- Jupiter cycle (12 years):
This cycle is recommended if you have enough price history (36 years and more). It is suitable for long term forecast. This cycle is very close to Juglar economical cycle.
Composite Box
You may work with just one cycle (I always start with the Annual cycle), but you can also create the projection line that is based on several astro cycles.
Click this button "+":
The cycle you are working with goes to "Composite Box". Thus you can add as many cycles as you need and obtain the projection line which is based on several astronomical cycles.
Look at this picture:
The blue line represents a composite cycle which is based on heliocentric positions of three planets: Mercury, Venus and Mars.
If you need to get more smooth projection line, not so choppy, increase the smoothing orb parameter in "Options":
Three steps ahead
In this class you have found the most important information regarding the creation of the models based on astro cycles. This technology is one of the most popular ones, so we have worked with it a lot. Some new features are highly recommended. We recommend to start playing with simple models as shown in this class; when you feel yourselves comfortable with them, you may try more advanced approaches. Here are new features that have been added to this module:
1) Committee technique: http://www.timingsolution.com/TS/Mini/12/index.htm
2) Optimization: http://www.timingsolution.com/TS/Study/astro_cycles_opt/index.htm