Universal forecast = Universal Language of Events + Neural Network
All the above was just discussing models and different modules of the program. Now we discuss the core idea of Timing Solution: getting a forecast. This process consists of two parts: a) creating a model that serves as a base for the forecast; b) making the forecast. It is easy to create a model, due to our Universal Language of Events (see above). Let us discuss the part "b". Timing Solution software does it by applying Neural Network technology. You do not need to be a professional in Neural Nets. It is quite enough to remember several things mentioned below.
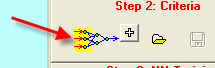
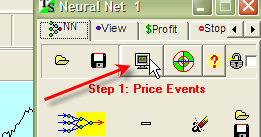
Click the mouse here:
![]()
You enter the part of the program where you will be able to create a forecast based on any event/events. Whatever model you apply, the forecast is made by Neural Net. It is a special math technology that studies how your chosen model has performed in the past and uses that knowledge to tell what is more likely to happen in the future.
Let us discuss the major items of Neural Net forecasting while creating a projection line based on Ptolemy aspects of transiting planets. This procedure will take about 5 minutes of your time. Follow these steps:
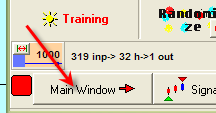
1) Run Neural Network module
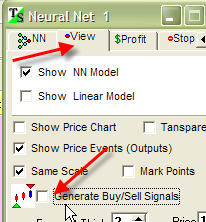
2) Click here (to define the outputs - things to be forecasted):
3) As an example, let us forecast the detrended oscillator with the period of 50 bars:
We often cal it RPO50 - relative price oscillator with the period of 50 bars. Detrending is necessary for Neural Network as it works better with detrended indicators (it looks for real connections of the price movement and the things that form your model; the existence of some trend confuses this search).
4) Click here:
Thus we define the Ptolemy aspects that are used to forecast RPO50 (our inputs). Let us do it for the orb of 15 degrees.
5) Now it is the time for Neural Network to start a learning procedure. Click here:
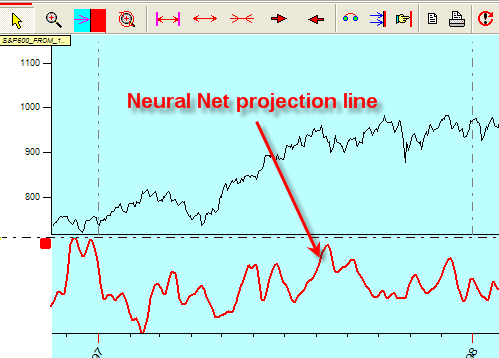
6) In seconds you will get something like this:
As you see, the projection line (a red curve) describes the RPO50 (a black line) very good inside the blue (training) interval.
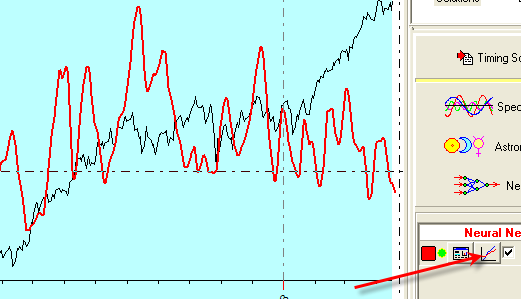
7) Follow these steps to put Neural Network's projection line into the Main window and hide the results panel:
(We do hide the Results panel because it covers the Main window. Do not worry, you are able to see this panel any time).
8) Here it is, our projection line (i.e. forecast) in the Main window:
Learn these steps as they are used for any model.
Now, let me summarize major items that you need to know about Neural Nets and forecasting with Neural Nets.
Before creating any Neural Net forecast, you need to understand clearly the
difference between the two things:
what you would like to forecast and what
this forecast is based on. In the terms of Neural Net technology,
things to be forecasted are called OUTPUTS while what this forecast is based on is called INPUTS.
Here are some samples of forecasts you can make with Timing Solution software.
You can make a forecast for:
Remember, these are just some samples. You can forecast practically anything, the only condition is having a consistent data set and finding a good model.
Understanding inputs and outputs is very important. I would recommend to read attentively the related parts of Timing Solution Documentation:
Object Oriented Neural Network - Outputs (what we are forecasting ...)
Object Oriented Neural Network - Inputs (what forecasting is based on ...)
Let us discuss them a little bit. We begin with Outputs. Click on this
button: ![]() . There is a big variety of possible indicators you may to
forecast with this software. As an
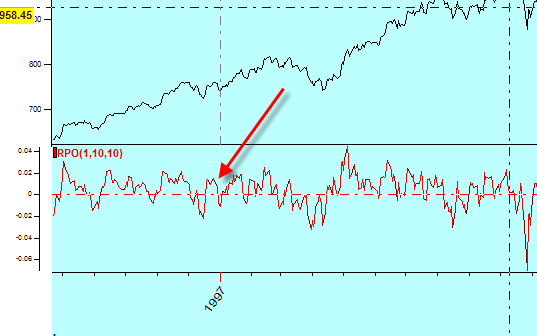
example, you can forecast the moves of the Relative Price Oscillator to catch short term swings:
. There is a big variety of possible indicators you may to
forecast with this software. As an
example, you can forecast the moves of the Relative Price Oscillator to catch short term swings:
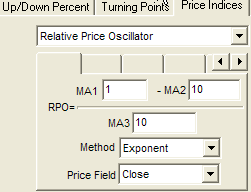
Here is how this oscillator (red bottom curve) looks against the real price:
To catch the turning points, the Detrended Zigzag is the best:
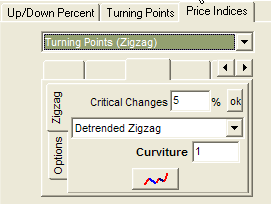
Here it is (the purple line):
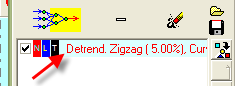
After the indicator to be forecasted is defined, it will be added to this list:
Now we need to define INPUTS, or the base for the forecast. Click this button:
Or, for some models, you can use a "quick" button: ![]() .
.
You will get this dialog window:
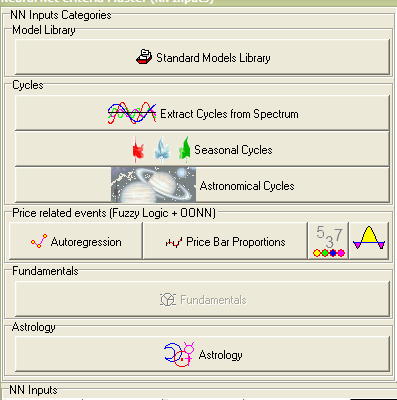
Here each button is devoted to different categories of inputs. I recommend to read the documentation regarding this issue.
When OUTPUTS and INPUTS are defined, we are ready to TRAIN the Neural Network. Click this button:
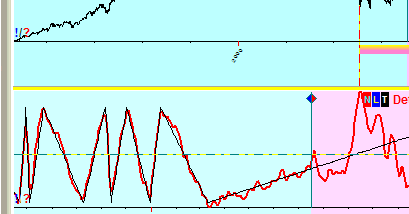
Now look at Main Window; you will get something like this:
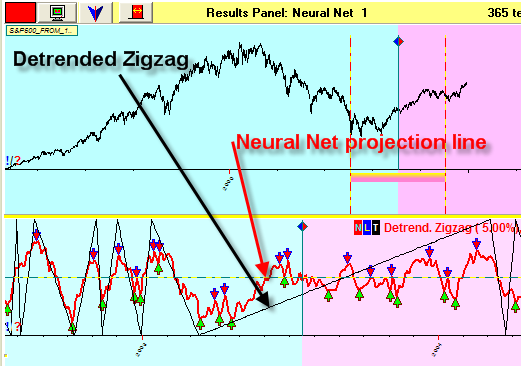
Here the red curve is Neural Net projection line, while the black line shows Detrended Zigzag (OUTPUT). You can disable buy/sell signals here:
Give Neural Net some time for training, and the red line becomes closer to Detrended Zigzag line:
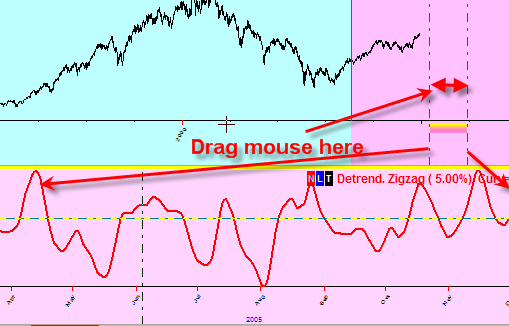
You can choose any part of the price chart to see the projection line for any time interval:
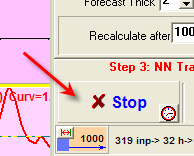
When you decide that the projection line is good enough for your purpose, click this button:
To see the Neural Net projection line in the Main Window, push this button to remove the Neural Net results panel:
and then click:
Now the projection line is in the Main Window:
You can manipulate this projection line; for example, display it together with the price chart:
At the end, I would like to mention that there are three levels of the forecast in Timing Solution:
1) It could be fully automated. See ready solutions in the module of the program called "Timing Solutions". With ready solutions, you do nothing except choosing the solution once. It is a fully automated process that provides you the general information regarding the market conditions. Ready Solutions are done for major indices mostly, and these Solutions are based on extended Back Testing of the different models.
2) Fast Solutions are just half automated. There you have more options to choose from and to customize a set of standard procedures to your particular data. But there are still a lot of calculations that the program provides itself, automatically.
3) To control the whole process of forecast creation, run the Neural Net module. It is a way to customize and fine tune any model to your financial instrument.