ULE - Universal Language of Events
This module allows to create simple as well as more advanced models analyzing everything that occurs in time and researching the effect of these phenomena on the stock market. We have developed a special way to deal with different events ("different" means really different events - physical phenomena, astronomy phenomena, price events, etc.; the list is not limited). Timing Solution users work with this module a lot, it is the most popular module of the software.
In this module, we define and record the events that may have some effect on the stock market performance. As soon as it is done, the program calculates the moments and/or time periods when these events take place - and shows them together with the price chart.
We believe that the best way to introduce main features of this module is going through some practical examples.
Example #1: retrograde indicator
Let us start with a very simple indicator. Suppose we have heard about the connection between the stock market and such thing as Mercury retrograde. So, we want to create an indicator that shows the periods when Mercury is retrograde. It is very simple to do with Timing Solution. Click this button:
and fill out the form as it is shown below:
By filling this form, we have defined the ULE event, "Mercury is retrograde". This event is marked as L1. Click "Calculate" button, and you will get the chart like this one:
These vertical stripes correspond to the time periods when Mercury is retrograde.
We can stop here and work with just this one event. Or we can go further - including other things into our consideration. Now let us create one more event. "Venus is retrograde". We deal with the same form as above, though we fill it out differently (see the picture below). And, because it is one more event that we add to the previous one, we should click "+" button after filling the form:
Now we are able to consider two events, L1 and L2, that we have for Mercury retrograde and Venus retrograde. If we would like to see these events on one screen, it is better to switch to ULE panel clicking this icon:
You can see how these two events work in time. (You can add here other events - as many as you like. Though we are able to see them all in one screen, it is just the price chart and pictures of different individual events. I would say that it is a first step in the analysis: looking at each event separately, we can quickly decide whether it is has any relation to our price chart.)
Now is time to create the more advanced indicator. Looking at the diagram above, we may decide that both events have some relation to the price ups and downs. And we may want to see the moments when MERCURY OR VENUS is retrograde, i.e. the moments when at least one planet (of these two) is retrograde.
In order to do that, type L1+L2 formula and click Calculate button once again. Here are these retrograde zones:
You may also do the opposite: create a model for the periods when BOTH MERCURY AND VENUS ARE RETROGRADE, i.e. double retrograde zones. This is very simple; type this formula L1*L2:
You should remember that L1+L2 means at least one of these events is active, while L2*L2 means that both these events are active. We use regular logical operators for these formulas.
Following the same logic, we can easily create triple or more complicated indicator. Just an example, this is an indicator that allows to find a very seldom event in history - the moments when Mercury, Venus and Mars are all retrograde:
Within 150 years, since 1885 till 2035, this phenomena (triple retrograde) took place three times only.
So, in brief, we take one event, consider it in regards to the changes in the price chart - and we can create an indicator/index based on this event. How? Just making necessary calculations and marking time periods or moments when this event takes place.
"Retrogrades" are just one type of events that are in discussion. What other events can we deal with?
Example #2: Sun aspect index
Another popular group is "Aspects". There are many talks about aspects, their power and meaning. We deal with the core idea - aspects as angle distances between the planets. And there is a lot of things that you may want to explore. For example, you may decide to create "Sun aspects index"; it indicates the Ptolemy aspects of the Sun to other planets. Again, we use a form of ULE module. Set these parameters and press "Calculate" button:
Immediately after calculation, you will get this diagram (together with Dow Jones Industrial index chart):
The higher this diagram means that more planets are aspected by Sun and with tighter orb.
If we take some other price chart instead of DJII's, it will be Sun aspect index for some other financial instrument.
BTW, through Main Window View you can modify this chart. Your choices are: displaying this index together with some price chart (as below) or in two different panels (as above). Also, you can change colors and the thickness of the lines:
You may consider aspects of other planets, not just the Sun, You may as well work with specific aspects between specific planets. And, as we did above, every new event that you record in this module can be combined with other events - creating the formula by means of logical operators.
We have looked at just two groups of astro events. Timing Solution provides more - just try all the tabs in this module. It is a very powerful tool. With it, you can check any statements regarding "secret" factors that may move the market - no matter how complicated they may sound. Do not be a believer; be an explorer!
ULE information module
After calculating Sun aspects index, you would like to know what aspects are active in a certain moment of time. In order to know that, follow these steps to run ULE information window:
Now when you make a mouse click somewhere on the Main price chart, these aspects will be displayed in ULE information window.
Example #3: Calendar of your personal aspects
There is one special theme related to the aspects. It is aspects to your Natal chart. You may like to know when, what and how hits your personal chart. Therefore, I will show how to create your personal calendar of aspects that hit your Natal chart. Still in the same ULE module, fill out the form this way:
Here we use NATAL-TRANSIT aspects (in previous example we used TRANSIT-TRANSIT aspects). Also pay attention that we use here CULMINATIONS of the aspects.
After the calculation, you get the calendar like this one:
The program saves this calendar into the file, so next time you do not need to repeat these calculations. You simply have to run a very simple program, TS Calendar, and open that file.
Example #4: Tidal force index
Another issue related to aspects is Tidal force. It is among the most frequently asked questions, so we have decided to calculate the Moon tidal force and show it together with the price chart. If you like to know how the Moon tidal force affects the market, you may want to create such an index. Follow these steps:
It is an access to the models' library. Choose there the event you need to consider:
and tell the program to calculate it:
This is the Mood tidal force displayed together with FTSE100 index:
Within a couple of minutes, we have created this new "indicator". You can easily conduct the statistical research for this indicator. Also, it is easy now to check any related statements, like this one: "when the tidal force of the Moon is high, the volatility is high as well" or: "the high tidal force tends to turning points of FTSE100 index".
The Moon tidal force is well discussed in many sources in regards to so many different sides of our life. What about the Mars tidal force? No problem; you can do a research for it as well. All you need to do is just click this button:
You will get the Events Model Editor window. Here you can set the parameters of the events in regards to your research. Choose there Mars and click "Replace" button:
(Remember that it will work only if you were doing previously a research on the tidal force of any other planet. If you did something else, you have to go back, choose the corresponding category of events the "Gravitation and Tidal Force" item; see below for more details about this module.)
After the calculation. you get the diagram with Mars tidal force.
You can also draw the tidal forces for a combination of different planets. To do that, click "+" button for each new object. Adding Mars, Venus and Mercury's tidal forces events
and calculating these events, you may get a diagram like this:
Here you see all three tidal forces of these three planets.
You can construct the more complicated events, like "tidal force index" as a sum of all tidal forces involved. Set L1+L2+L3 events formula:
Here L1 - Mars tidal force, L2 - Venus, and L3 - Mercury tidal force. L1+L2+L3 is the sum of these tidal forces:
Apply this index to different financial instruments to see how they correspond. Also, you can adjust this formula to any particular financial instrument setting some specific weights for these terms:
Here I increased the weight for Mercury tidal force five time. This is how this index looks now:
Important: I am not telling you here to use this index for your financial instrument. I am showing you the way how to find a proper index for your stock.
I recommend to investigate Model Editor Window. There are a lot of events there. This is a heart of Timing Solution software. These events are used to generate the projection line with Neural Network module. Though there are a lot of events used there, we constantly add new events.
More Examples
Here more examples are shown:
-Transit Sun passes Fire signs:
- transit Sun passes middle point between transit Mercury and Venus:
- the difference between the speed of the Sun and Mercury is zero (i.e the Sun speed has the same speed as Mercury):
and others ...
Efficiency Test
Efficiency test module allows to estimate the effect that any phenomenon may have on the stock market.
Let's analyze how the aspect Sun - Jupiter conjunction
affects Dow Jones index. Fill in the form for this aspect and click ![]() button:
button:
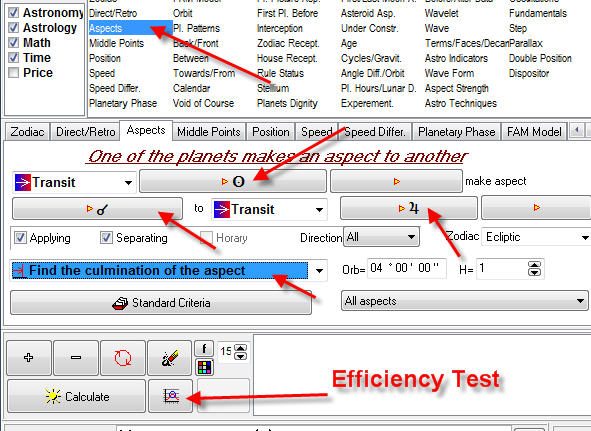
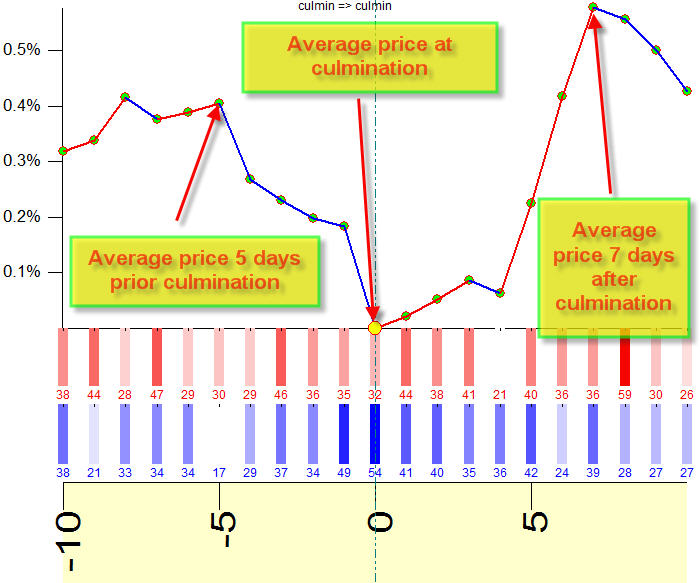
You will get the efficiency test diagram. This diagram shows the average price movement around the culmination date of this aspect, plus minus 10 days:
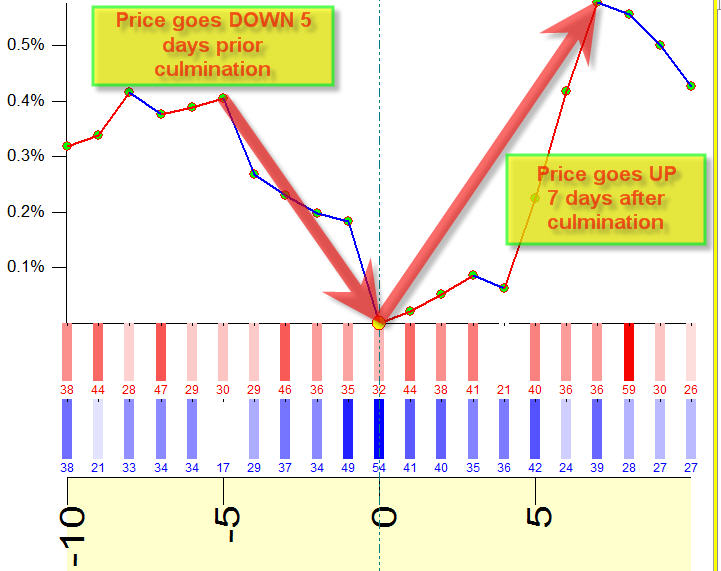
Thus we can see how Sun - Jupiter conjunction aspect affects the stock market in average. For our price data, it looks like the price goes DOWN 5 days prior the culmination, and then, after the culmination, it goes UP for another 7 days:
Remember that the averaged diagram does not provide the exact picture that you should use immediately. The efficiency test sometimes indicates a strong downtrend movement simply due to the fact that the strong downtrend movement coincides with this aspect. Therefore, the efficiency test serves mostly as an indicator of the factors that you should consider.
When we have the efficiency test done, it is very simple to figure out how the price moves in reality. Just drag the mouse cursor from the point A (a small circle that corresponds 5 days prior the culmination of the aspect on the Efficiency test diagram) to the point B (the culmination point of the aspect). Here is the result:
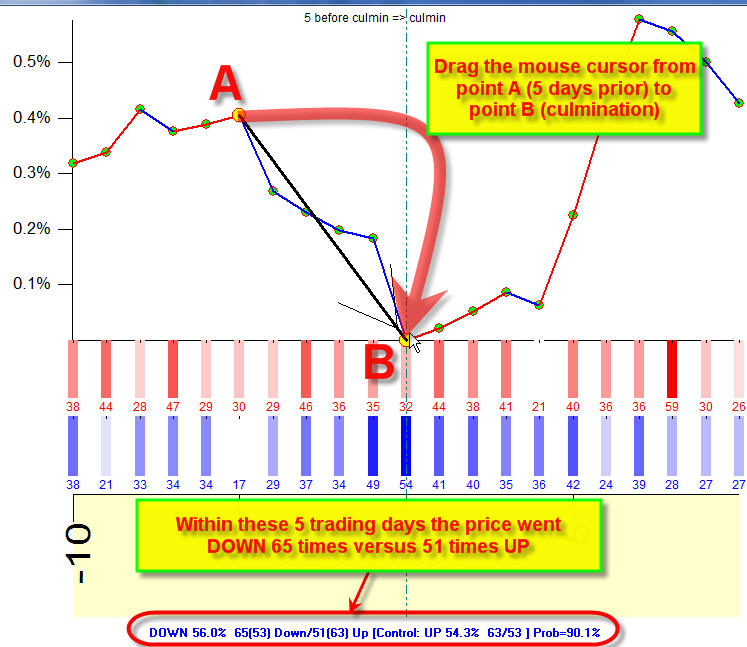
As you see, the price went DOWN 65 times and 51 times it went UP. In other words, during our data set, this aspect took place 116 times in total, and 66 time the price went DOWN a week prior the culmination of the aspect, and 51 times it went UP. In this particular case, it is hard to make a conclusion as the effect is not certain. In real life situation it means that if you decide to trade using only this information (that the price tends to go down 5 days prior Sun - Jupiter conjunction), your chance to succeed is not certain as well.
However, that same efficiency test (for the same aspect, and based on the same data set) can give you a hint for another strategy. It is shown on the same diagram. Let's look at the price movement after the culmination (drag the mouse cursor from the point B (the culmination point) to the point C, 7 days after the culmination):
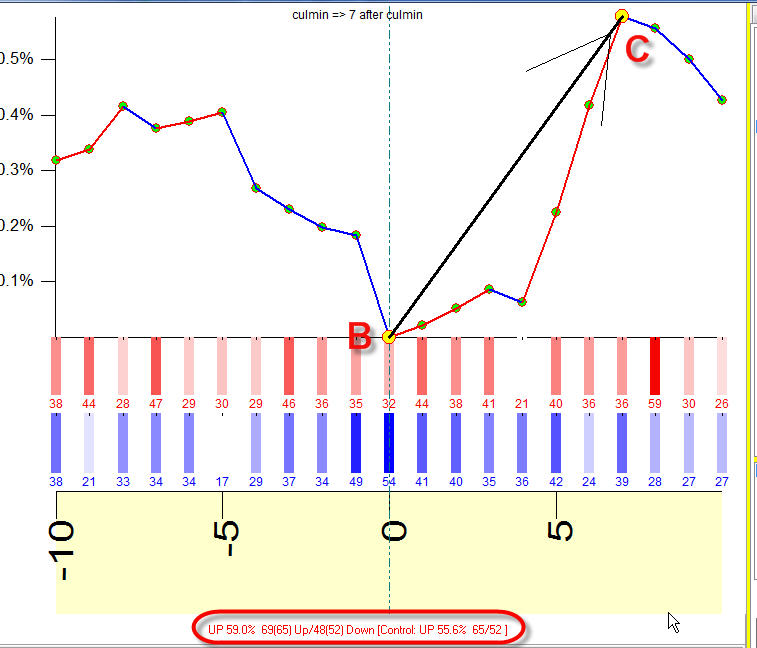
The price went UP 69 times versus 48 times DOWN. To me, this trading strategy is better than the previous one.
The best strategy
Now we will try to find the best strategy. Follow these steps:
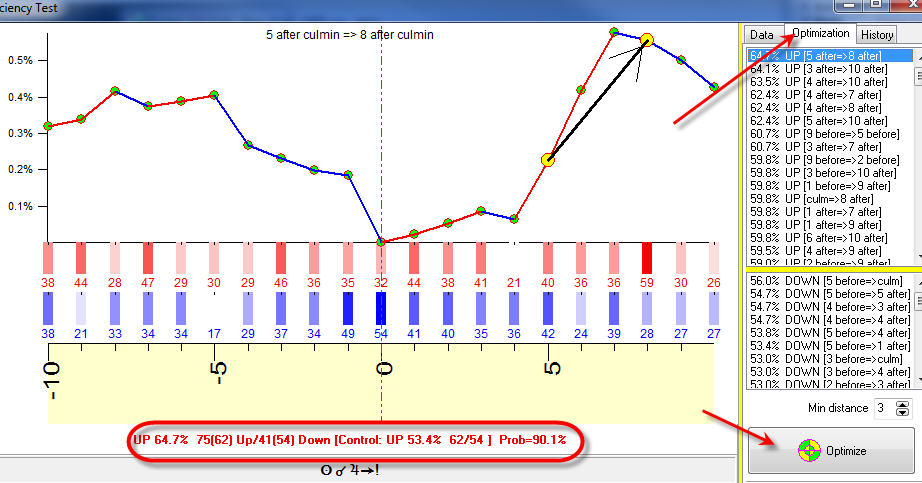
After clicking "Optimize" button you will get the rated list of strategies. Highlight the first one: 5 days after => 8 days after the culmination; you see that within this period of 3 trading days the price went up 75 times versus 41 times down. This strategy is better.
Risky strategy
You always should remember that the price movement direction that shows Efficiency test diagram and the real price movement can be different.
Look at this example: Efficiency test is calculated for Gold price for the moments when the Sun ingresses Scorpio:
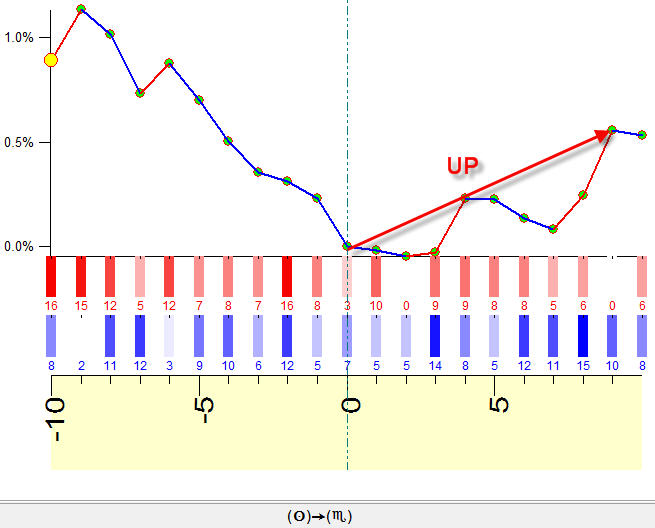
This diagram shows an uptrend movement during 9 trading days after the ingress. Now let's try to see how many times the price went UP and how many times it went DOWN within those 9 trading days after the Sun ingresses Scorpio. Drag the mouse to calculate this strategy:
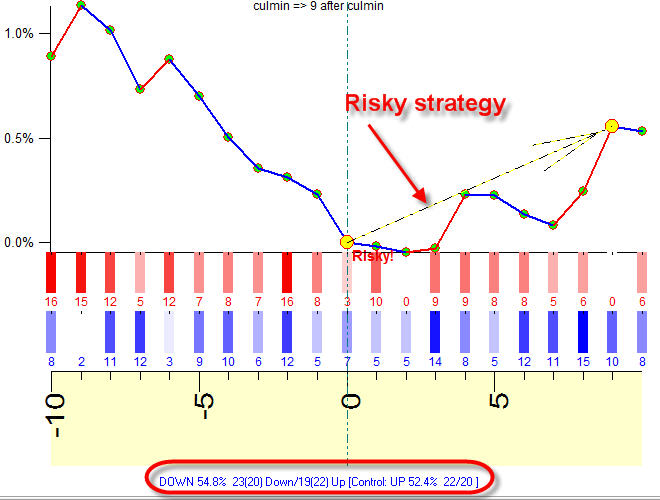
As you see, this is actually DOWN strategy (23 Down versus 19 Up cases), while the Efficiency test indicates Up movement. This is RISKY strategy, and the program marks such strategies using a dotted arrow. Be cautious with risky strategies.
Turning points
The colored red/blue bars at the bottom of the Efficiency test diagram give us some clues regarding the effect of this aspect on turning points.
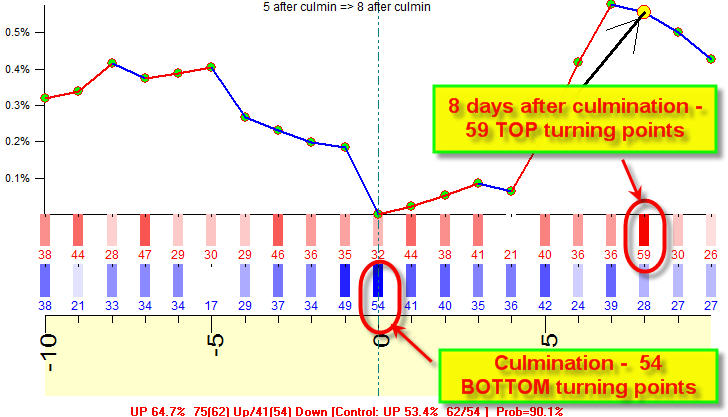
The brightest red bar with digits 59 indicates that 8 days after the culmination of this aspect TOP turning point took place 59 times, this is higher than the average value (look at other bars). Therefore, TOP turning point is more probable 8 days after Sun-Jupiter culmination.
In the same manner, the brightest blue bar with digit 54 indicates a probable BOTTOM turning point for the day of the culmination.
Control group
Let's consider the information string below in details:
![]()
It shows that the price went UP 75 times versus 41 times DOWN.
But there are also digits in brackets, for UP ![]() and for DOWN
and for DOWN ![]() . What do
these digits 62 and 54 mean?
. What do
these digits 62 and 54 mean?
These are CONTROL GROUP digits. They mean that in average (regardless any aspect or any other phenomena) the price moves UP 62 times versus 54 times DOWN. In other words, the price moves UP more often than DOWN, it moves UP 53.4%. And it happens not because of the aspect that we explore, it is just the natural tendency of the market within our data set.
In practice it means that you should pay a special attention when the amount of UP cases is bigger than in the control group. in our example we have 75 UP cases while control group indicates 62 UP cases only. Thus this aspect generates more UP movement than it occurs in average.
The same situation is for DOWN strategy:
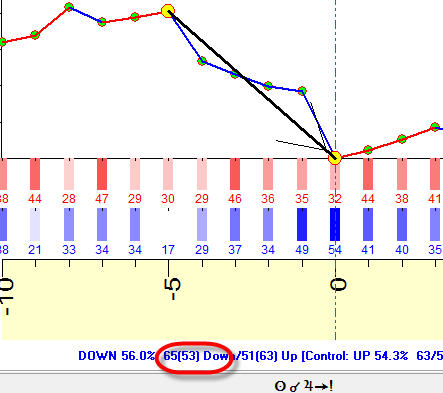
This strategy generates 65 DOWN cases while the control group shows 53 DOWN cases only.