Phenomenological model for Hang Seng Composite Index
written by Sergey Tarassov
This article is the illustration of some approach to simplified creation of the astronomy based phenomenological models. As an example, we will make the forecasting model for Hang Seng index. The price history from the year 1970 is provided by John Ng.
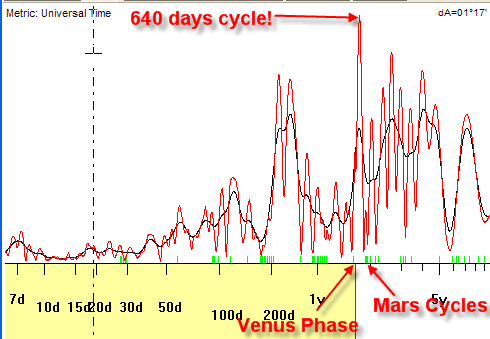
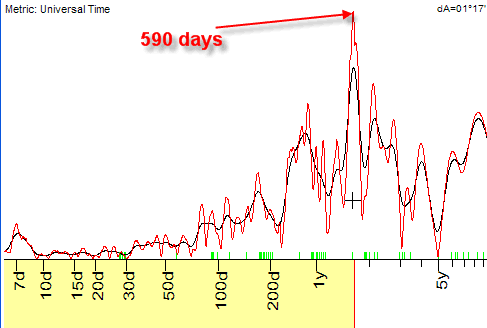
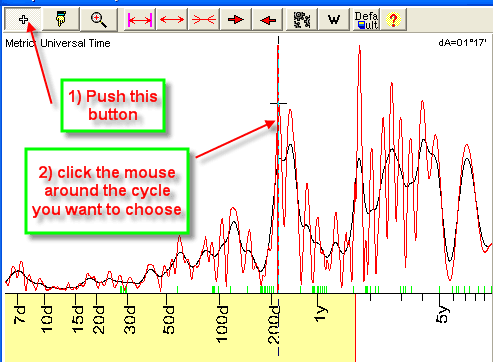
First of all, let us look at the Spectrum diagram: it may give us some hints regarding this market's habits:
This is multiframe spectrum; you can see a very strong 640 days cycle. Look at lime stripes at the bottom; they correspond to the astronomical cycles. The closest to this peak cycles involve Mars and Sun-Venus relationship (actually, this is Venus phases cycle). Sometimes these stripes do not exactly correspond to some astronomical cycle, it may be caused by nonlinear effects.
Let us create now a forecasting model based on these cycles. Run Neural Net module and click here to define these cycles:
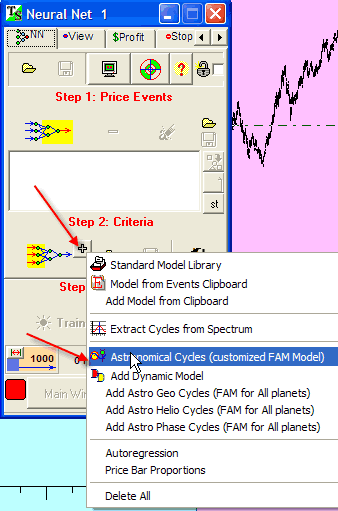
You will get this window:
This is a special window to create models based on astronomical cycles, or so called FAM type models. FAM stands for Floating Angle Model. This type of models is designed to catch all astro sensitive points for your financial instrument (in our case, for Hang Seng index). FAM model does not take into account when this financial instrument has started (thus eliminating the debates on true natal charts); it simply records some initial parameters coincided with moments when astro events had some specified impact on this financial instrument.
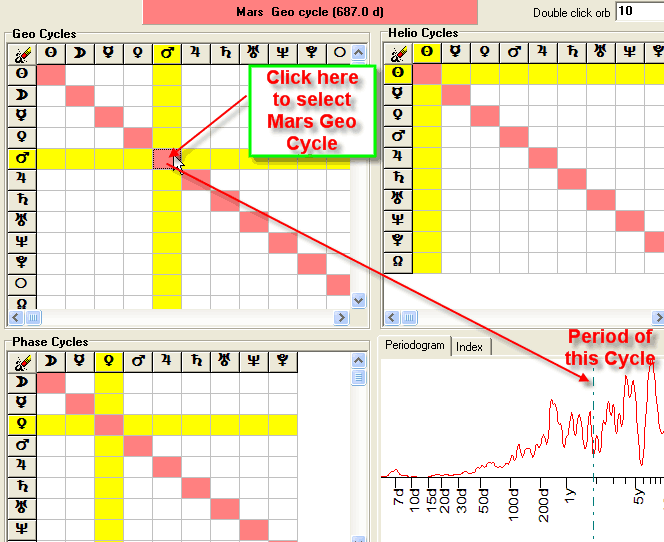
In this window, you can see three tables that correspond to three different types of zodiacs: Geocentric, Heliocentric, and Phase zodiacs. Red diagonal bars correspond to the pure cycles - like Mars cycle, instead of Mars-Jupiter cycle that involves two planets.
You can choose any cycle typing the value of the desired orb for this cycle:
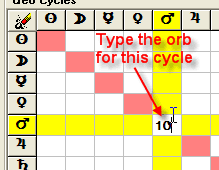
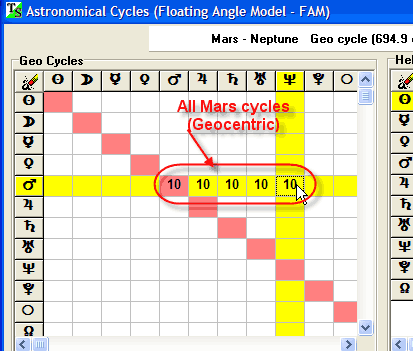
As the example. we choose Mars cycle with the orb=10 degrees, it means that this model analyzes each 10th degree of Zodiac. The same result can be obtained by double clicking on the appropriate cell (no typing).
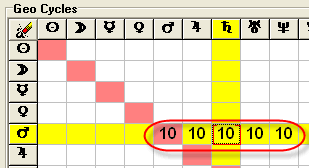
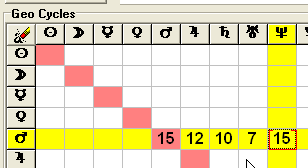
I choose 5 cycles in Geocentric zodiac involving Mars: Mars itself, Mars-Jupiter, Mars-Saturn, Mars-Uranus and Mars-Neptune
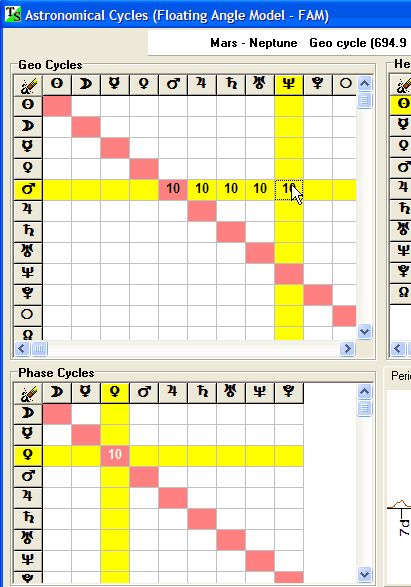
Also I select Venus cycle in Phase zodiac. There are 6 cycles in total to consider. The whole planetary portrait of our market is:
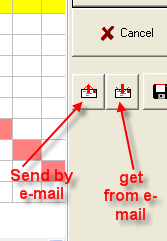
You can send this "portrait" to your friend and receive a similar one by e-mail:
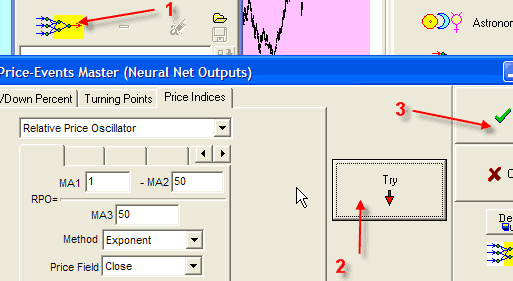
We have chosen the "players" for our model. Now we need to define what we would like to forecast. Let us take the oscillator with period 50:
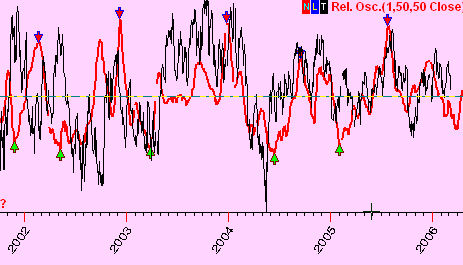
Click on "Training" button, and after 15.000 steps of training you will get this:
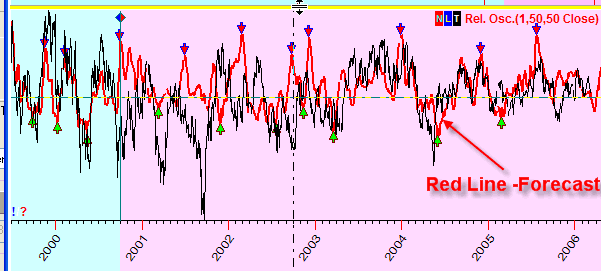
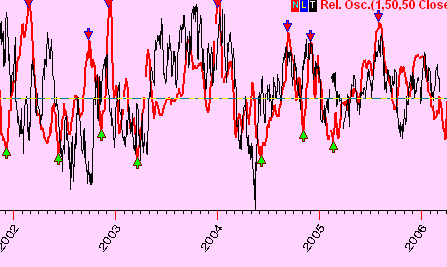
The red line represents the projection line obtained through these cycles. This line provides the forecast from the end of 2000 (red region).
It looks like this model provides a rather good forecast for 2003-2006 years.
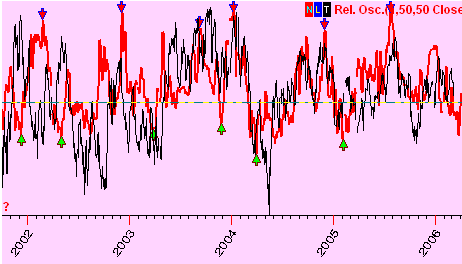
However, for 2001-2003 it has not been that good:
The most important issue in creating the phenomenological models is defining the correct planetary profile. There are no complete instructions yet as how to do that. You have to use all available tools. Here we have started with the Spectrum module. It gave us some information about probable cycle's length. Other good hints can be provided by Astronomical module. Do not use many astro cycles, just a few most important cycles usually give better projection line than a huge model based on all known astro cycles. In this particular example, the most informative planet is Mars. The phase of Venus (584 days) is another strong cycle to consider.
By the way, I have met this cycle doing research for many other financial instruments. For example, for British Pound/USD, this is the strongest cycle:
Here are some questions asked by one Timing Solution user:
Using the Hang Seng Phenom. article as a template for forecasting other
instruments I have come up with a few questions:
First, when I run the Spectrum module I can see the
astronomical cycles in green (right above the horiz time axis). There are
three situations that occur:
1. You find an astro cycle (Geo, Helio or Phase)
that seems to catch the spectrum peak quite well. You select this by
double clicking, the orb will fill in the box and the FAM model for the
sensitive planet(s) will be available for the Neural Net. Question:
Often the peaks have more than one astro cycle association. I
assume that we really only need to select one astro cycle per peak to avoid
redundancy. True???
2. Now you see one where there is no green
bar below a significant peak so there is nothing to select (in terms of an astro
cycle). Since this peak represents a strong cycle do
we send that spectrum peak to the Neural Net as simply a fixed cycle? How
is that done exactly?
3. You note that as you use the cross hairs
across a peak the days cycles show in the upper right and next to that you see
something like "2H Mars-Neptune." Thus, there is an association
with the 2nd Harmonic-Helio-Mars Neptune. Correct? With
this methodology do we simply select Helio Mars Neptune and let the Neural Net
work it out with the FAM input? Or do we need the ability to input
a 2nd, 3rd, 4th, etc harmonic into the Neural Net?
Second, can you address the issue of appropriate orb and daily vs. weekly vs. monthly data based on what we are trying to predict.? Maybe FAM compensates somehow, but I was surprised that in the first Phenomenological article you used an orb of 15. You found that Jupiter, Saturn and Neptune were the "drivers" and they become the 3 inputs into the Neural Net. As slow as these planets move I would have imagined the need for a significantly smaller orb--like 1 degree. In the second article on the Hang Seng Index you used data since 1970. It was not stated whether this was Weekly Data or Daily bars? [My instinct says that for this long of a period you would use weekly data] The "portrait" ends up with Mars-Zodiac and Mars-to-outer-planets plus a Venus-Phase input [ "players."] Whereas, above you used orb=15; here you used orb=10. This was confusing for me as I would have thought the orb would get larger as you moved inward-as far as planets are concerned. Still even with an orb of 10 that seems large compared to the movement of Mars, Mars-Jup, Mars-Sat, etc. I would have thought that Mars orb would be 2-3 degrees and Venus orb would be 2-4 degrees.
I know that we are suppose to jump in and experiment to find what seems to work best (and then share our observations and back testing results). By the same token, is it possible for you to publish some parameters that might give us appropriate combinations or ranges of parameters so that we don't spin our wheels too much?
These are good questions, they are related to the most important issues regarding the phenomenological model. So, my answer is divided on three parts: general notes, practical recommendations and theoretical issues.
#1 General notes
First of all, I would like to mention that it is the PHENOMENOLOGICAL model. It means that we have no fixed rules here applied for all cases. We have recommendations only, and we should check all possibilities. This is due to specific status of astro finance research based on astrology. "Up until now, astrology has not been a science at all - not even an erroneous one. It has been a craft or technology, which is quite different." (Robert Hand "Essays on Astrology"). So, instead of applying laws and rules, we can only PLAY with all possibilities. And I simply try to give you the template/recommendations/descriptions of typical situations in this game. This is a main difference between phenomenological and Back Tested models: BT models need a lot of calculations to get the optimal parameters. For me, it would be the easiest way to provide the module that calculates dominant planets for any financial instrument automatically. But it will be a fake. In this case, the formal approach can kill the essence of these models. The computer does calculations faster than a human; however, a human is a lot smarter than a computer.
How did I PLAY in this particular case? I have started with the thing that strongly impressed me: the Spectrum diagram. Here it is for our data:
Sure I have tried to create the Spectrum based projection line. The results were not that impressive. OK, may be the astronomical cycles will help? The nearest to 640 days are all Mars cycles and Venus phase.
So, I tried some cycles with Mars involved (Mars, Mars-Uranus, Mars-Neptune):
I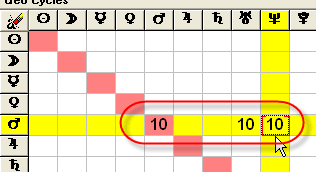
The results (i.e., projection line) have become better. Let's add other planets:
It has been a good move. Results are more promising! The next step I would like to recommend for playing is Orb, like this:
Try to add another planetary cycles. When you will spend some time trying different cycles and orbs, you will get a feeling that you know your guy (i.e., your financial instrument to be forecasted) better. It is one of the reasons why we are starting the research inside TS Yahoo group. Learning more about the cycles relevant to each financial instrument, we will be able to make templates for major groups of stocks/futures/indices.
#2 Practical recommendations
Question: I assume that we really only need to select one astro cycle per peak to avoid redundancy. True???
I do not think that this approach provides a good results. I
tried. May be, it works for other financial instruments...
The problem is that the Spectrum catches the regular cycles only, while the
planetary positions and planetary cycles are not regular. Add to this much more
important fact that the planets impact the stock market in NON LINEAR manner
(see about it in the next topic). So, I would recommend using Spectrum as a
hint, but not as a final arbiter. Maybe, the usage of composites is more suitable
to reveal the dominant planetary pairs. In case of Hang Seng, we have one very
strong cycle, it is the main hint given by Spectrum. But once again, you need to
experiment yourselves.
Question: Since
this peak represents a strong cycle do we send that spectrum peak to the Neural
Net as simply a fixed cycle? How is that done exactly?
Do this:
a) Extract the cycles you choose:
2) Put this cycle into the clipboard:
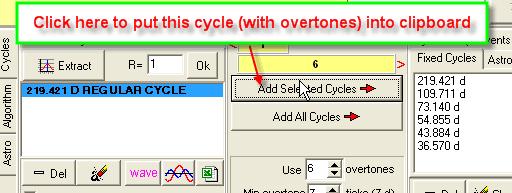
3) In Neural Net module, take this cycle from the clipboard:
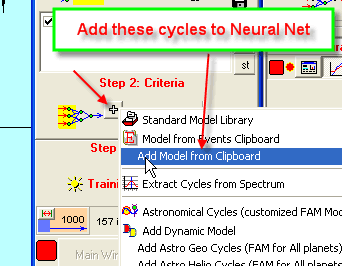
Thus, in this Neural Net, we have added chosen cycles to existed events (for example, astro FAM cycles).
One observation: it looks like there is incompatibility between astro cycles and regular (math) cycles. I have found that the results become worse when I add astro cycles to the regular cycles. The following table reflects my notes for cycle's compatibility:
|
Spectrum (regular) cycles |
Geo Cycles |
Phase Cycles |
Dynamic Model |
|
|
Spectrum (regular) cycles |
|
Not Compatible |
??? |
??? |
|
Geo Cycles |
|
|
Not Compatible |
Not Compatible |
|
Phase Cycles |
|
|
|
Compatible |
|
Dynamic Model |
|
|
|
|
But this should be tested more for different financial instruments.
Question: You note that as you use the cross hairs across a peak the days cycles show in the upper right and next to that you see something like "2H Mars-Neptune." Thus, there is an association with the 2nd Harmonic-Helio-Mars Neptune. Correct? With this methodology do we simply select Helio Mars Neptune and let the Neural Net work it out with the FAM input? Or do we need the ability to input a 2nd, 3rd, 4th, etc harmonic into the Neural Net?
The FAM model for 2H, 3H, 4H is in my plan. This issue needs additional work/time. Extremely complicated math stands behind it.
Question regarding the orb. In this example we used daily data, while in the first articles it was 2 examples with monthly data. It explains the choice of 10 and 15 degrees.
By the way, "orb" for FAM models is something different than the orb used in astrology. You are right from the point of view of classical recommendations (when you know the exact time to cast the chart, etc.). FAM model's orb means the range where we are looking for sensitive points. The program considers each degree of Zodiac and looks for the sensitive point inside this orb. The main thing defined by this orb is that there is just one sensitive point within this orb. (I did also a possibility to catch several sensitive points inside the orb; the results did not change).
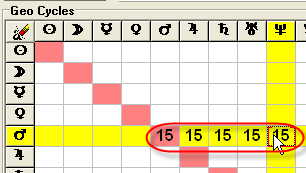
In this particular case, I recommend to PLAY with this orb, like this:
and optimize Neural Network under these conditions.
Practically the PLAY with the orb may look like this:
We set orb=15 for all cycle and have got this projection line:
For orb=10:
For orb=5:
The program did these three projections within several minutes.
#3 A little bit of theory
The astronomical cycles can be not corresponding exactly to the peaks of Spectrum diagram. The reason is non-linearity. I have created two model examples to explain how it works.
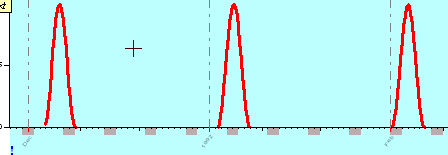
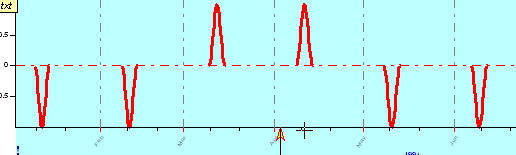
First, I have created the price data that exactly follow the New Moon. We have a wave 6 days around the New Moon:
Here is the Spectrum for this data:
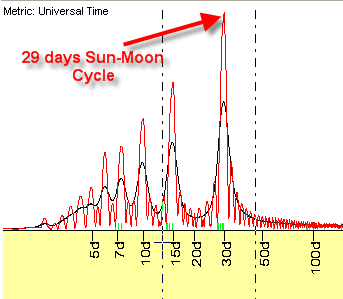
We definitely see here 29 days Sun-Moon cycle and related overtones.
Let's make these data nonlinear. Now the wave will be positive when Mercury is preceding the Sun, otherwise (when Mercury follows the Sun) it is negative:
In other words, we have now the more complicated movement that depends on three planets.
Look at the Spectrum for these non linear data:
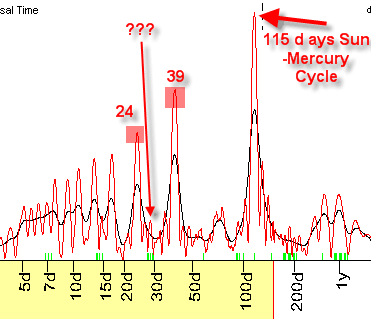
We do not see the 29 days cycle at all, instead we have two cycles, 24 days and 39 days. The original 29 days cycle has been split on two cycles.
It is a simple example of non-linearity.
Missing Link - Multi-Scenario Approach
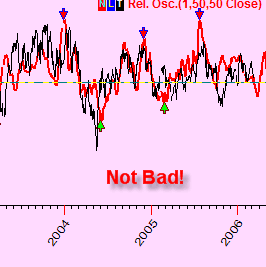
Creating the forecast model for Hang Seng, we have found that this model provides the good projection line for 2003-2006 years:
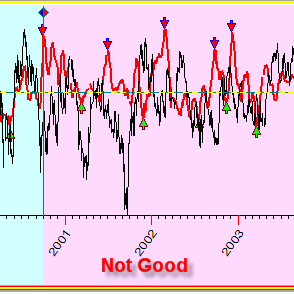
and not so good for 2001-2003 years:
Why has it happened? I believe the stock market usually has at least 2 scenarios of behavior to follow. May be it is related to the domination of different groups of traders.
In this case, I would like to recommend creating an alternative model. I have a very strong suspicion that for Geocentic FAM model the alternative model is Dynamic Model. In the upgrade of March 24, 2006, it is possible to create the more selective Dynamic models. Let's create the alternative Dynamic model for Mars related cycles. It is here:
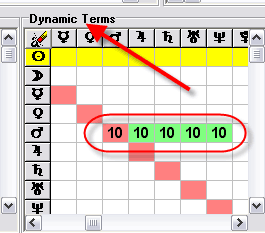
It uses the same cycles as FAM model in our example, but describes another modus vivendi of these cycles. Now this model works good in 2001-2003:
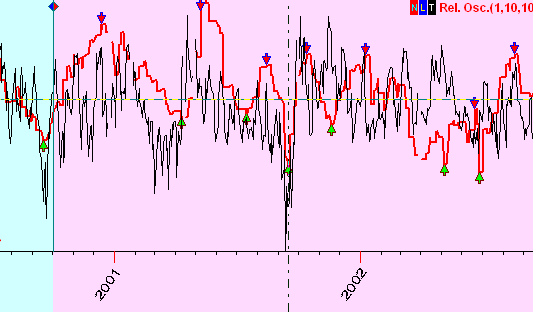
But after that it works not so good. I think it is a good practice to analyze two projection lines.