Square of Nine
General idea
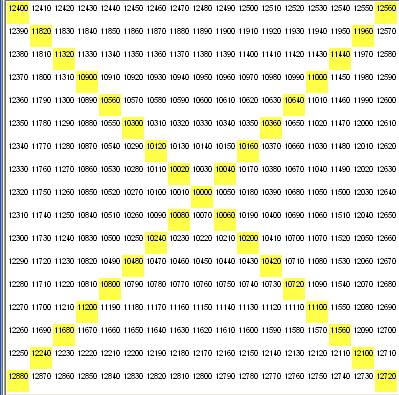
This is Gann�s square of nine (SQ9):
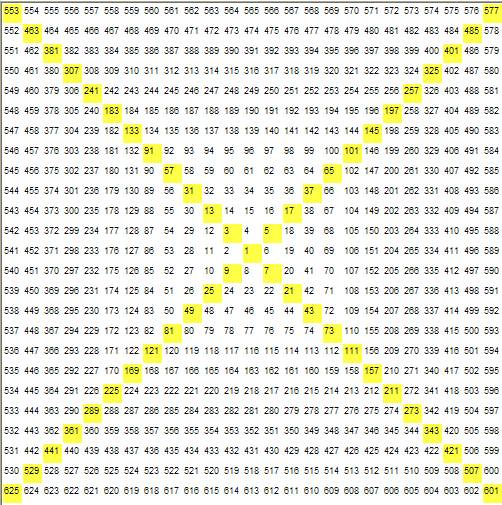
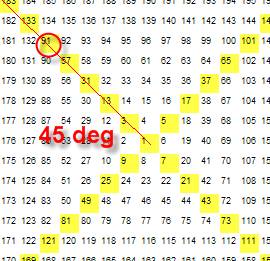
The digits in this table are arranged in some order. Each digit is related to some angle. As an example, for digit 91 the corresponding angle is 45 degrees:
According to the theory, the turning points price levels are located at the Major angles such as 0, 45, 90, 135, 180, 225, 270, 315 degrees:
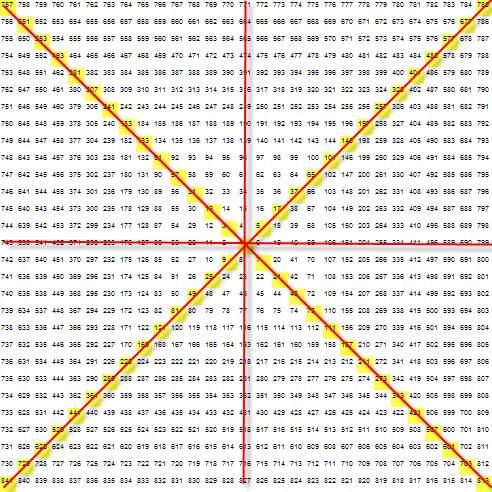
In other words, the turning points are located along these red angles.
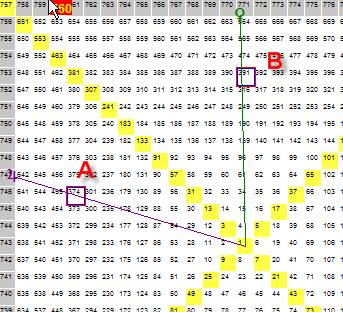
According to another theory, the angle between two succeeding turning points should be some special angle (such as 90, 120, � degrees):
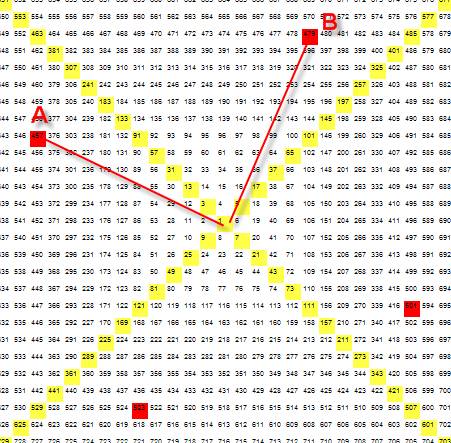
For example, the angle between two succeeding turning points A and B is 90 degrees.
According to one more theory, the �key� angle where the price changes its trend is defined by a planetary position:
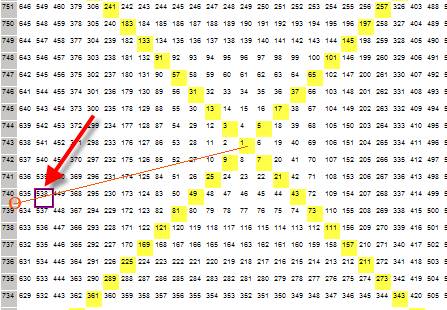
On this picture, the next turning point 538 is shown by the Sun�s position (you may consider other planet�s position as well).
According to another theory, the key angle is defined by the angle between two planets.
Like this one:
Here the angle between two turning points A and B is defined by the angle between Venus and Jupiter.
Each theory has its followers. You, as the user of our software, have an advantage: you can verify all these theories using SQ9 module.
Major parameters
How to work with this module? First of all, define the major parameters for your chart:
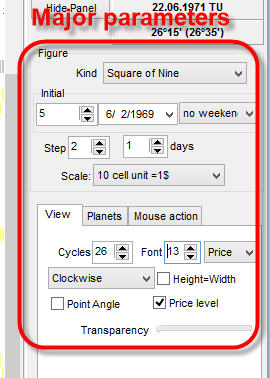
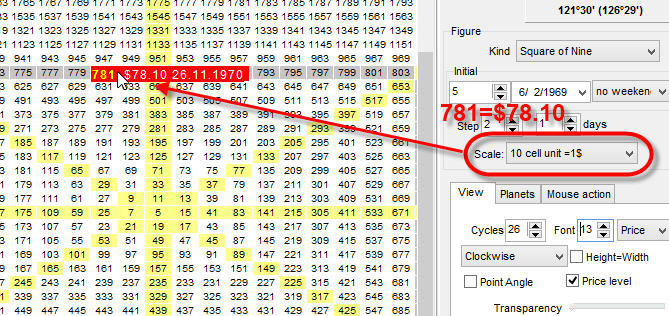
Initial, steps: here you can define the value of the central cell and the step (i.e., the difference between two cells):
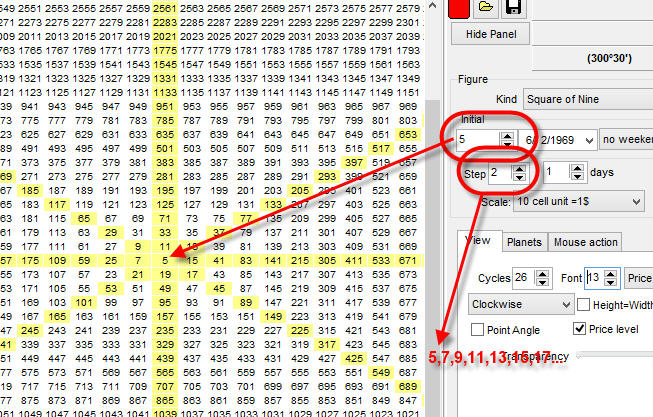
Scale parameter allows specifying the scale between the digits on this diagram and the real price:
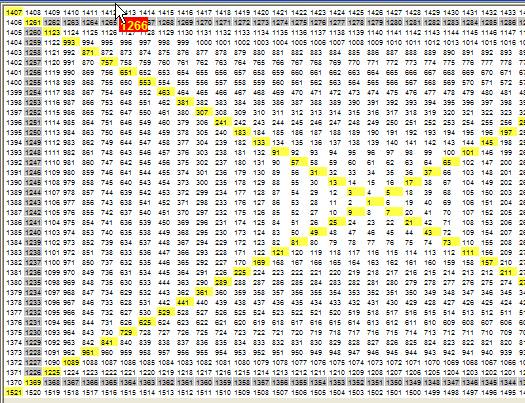
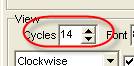
Cycles parameter allows to increase the table range:
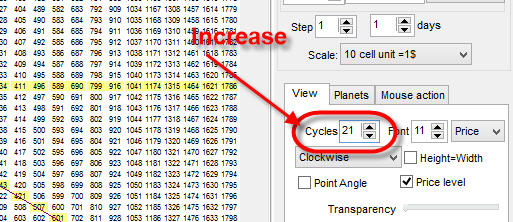
For example, if you analyze S&P500, you need a bigger table. Increase the �Cycles� parameter to get this:
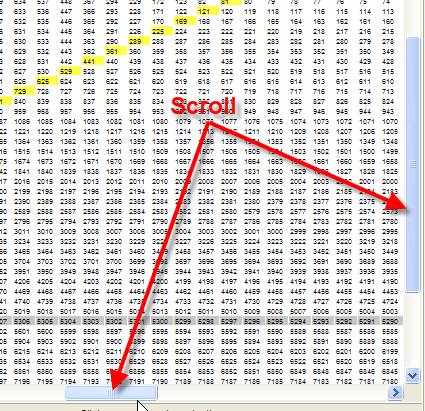
Huge tables. If you work with big tables, we recommend to decrease the Font size parameter. Here is the example of some huge table that covers almost 17.000 cells (for DJIA):
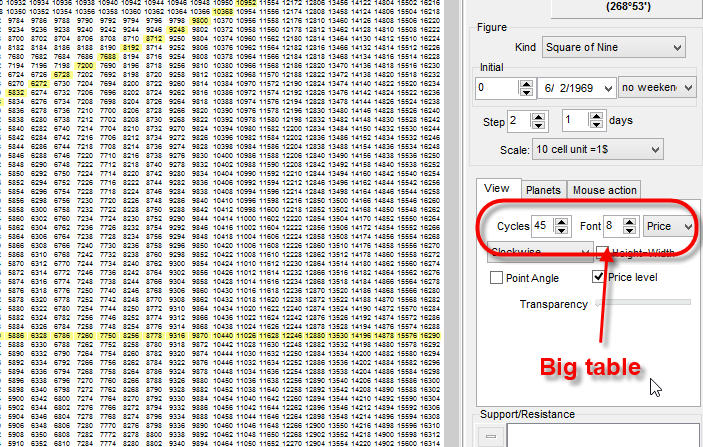
Scroll it using these scrollbars:
Square of Nine support/resistance levels
Now we are ready to work with this module.
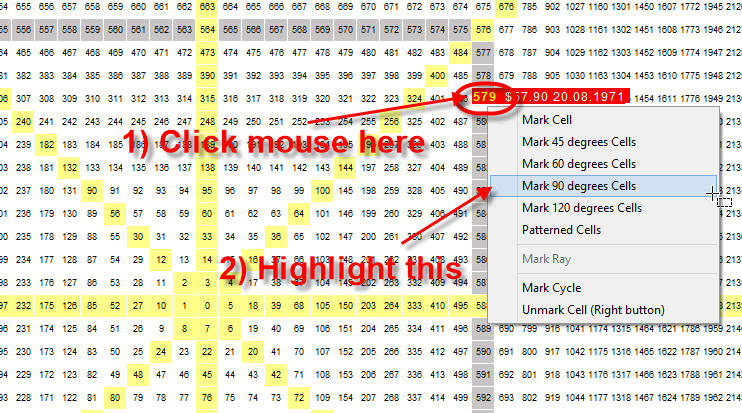
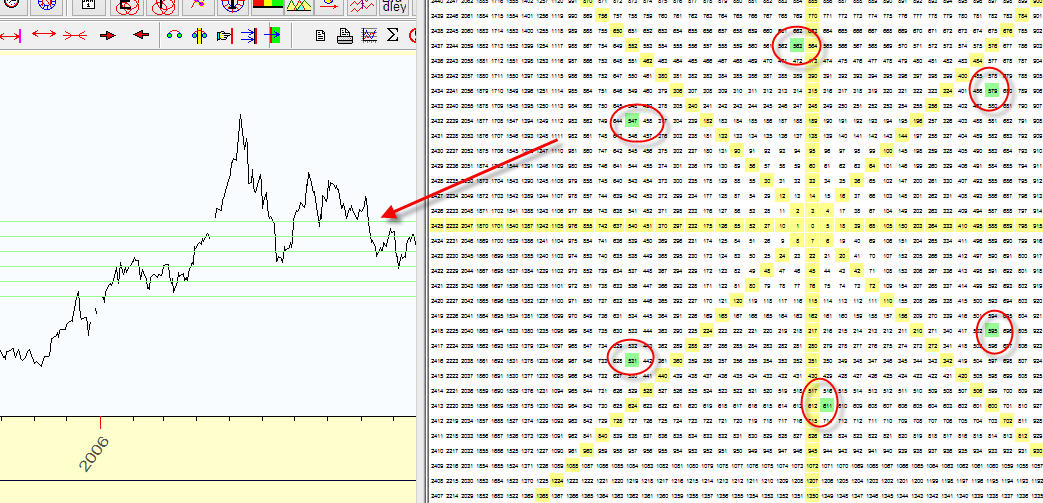
Suppose we will analyze the price level 579 (gold); and we want to find quickly the points that are located on 90, 180, 270 degrees in respect to this point. In order to do that, just click your mouse on the cell 579 and highlight the appropriate item of this menu:
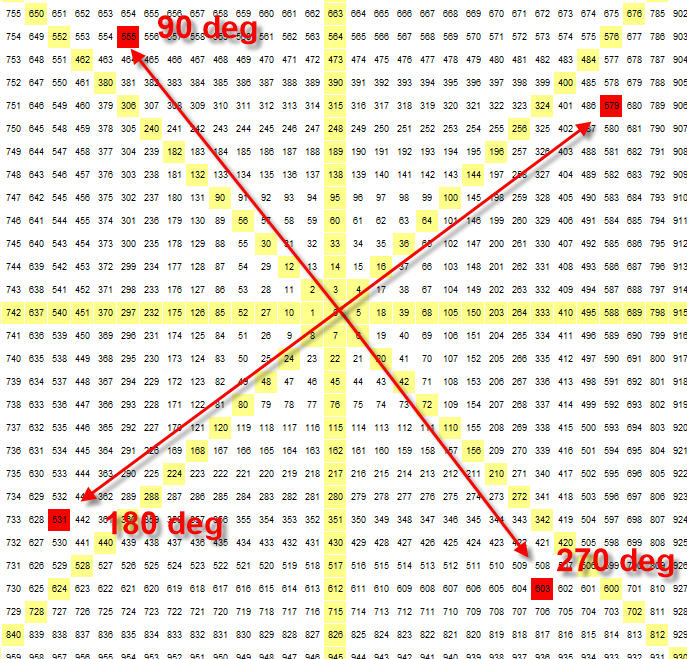
The program will mark these cells:
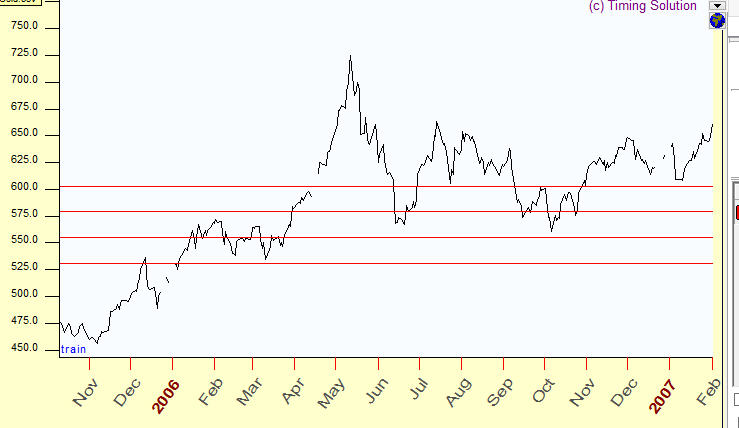
Pay attention, these four price levels will be immediately displayed in the Main screen:
This is another example based on 60 degrees pattern (hexagram, star of David) with staring cell 579=$579:
Thus you can try different figures and different starting points.
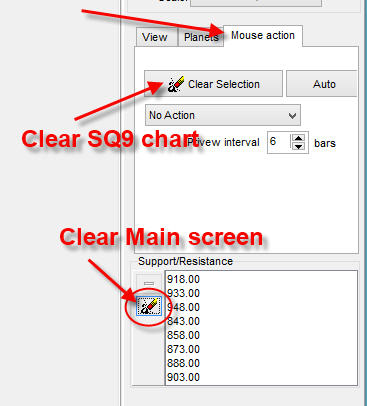
Clear chart. To clear Square of Nine chart and remove support support/resistance levels from the Main screen, use these buttons in "Mouse action" tab:
Planets
You can display the planetary positions overlay of Square of Nine table, in "Planets" tab you will find all necessary parameters for this charting:
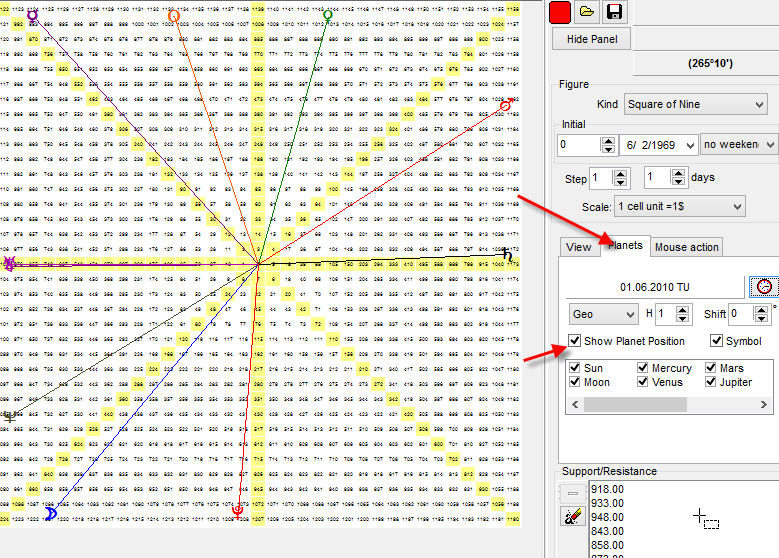
To define the transit data (which is used to calculate the planetary position), click on this button:
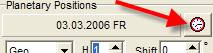
Also you can click a mouse button anywhere on the Main screen, and the program will recalculate the planetary positions automatically.
One more feature is the possibility to shift the planetary positions for ALL planets on certain degrees:
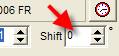
This feature is very useful if you need to combine some cell with some planetary line. As an example, varying this shift parameter I combine the 615 cell with Jupiter line.
There is one more possibility: you can extract top/bottom turning points from the price chart and put the price levels that correspond to these price levels o Square of Nine chart.
To do that, follow these steps:
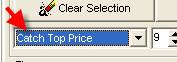
1) In "Mouse action" tab highlight "Catch Top price item":
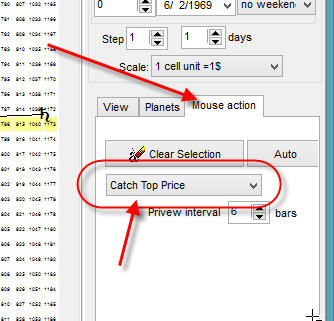
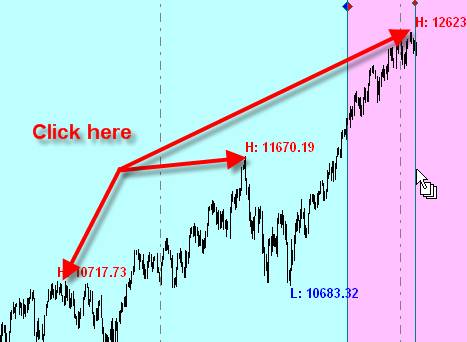
2) In the Main screen, make mouse clicks around some major tops:
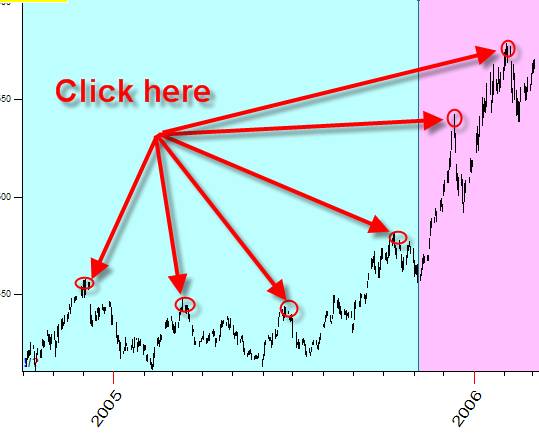
The program catches the major tops and marks the cells that correspond to these tops by red color squares:
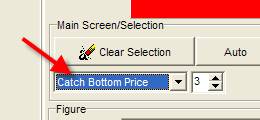
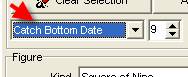
3) Next step: highlight "Catch Bottom Price" option:
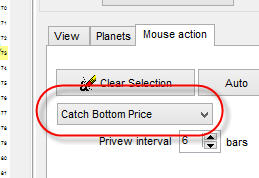 �
�
and make mouse clicks around bottoms in Main screen.
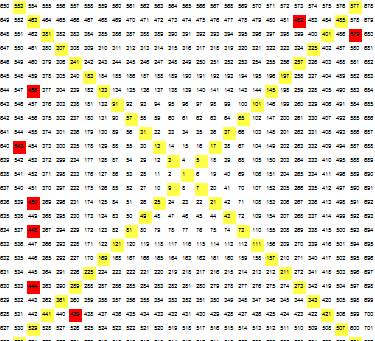
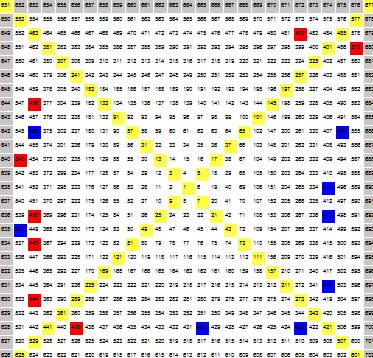
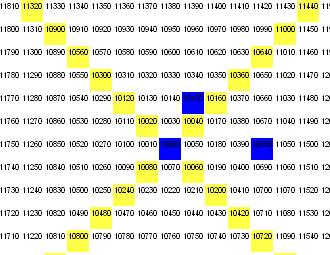
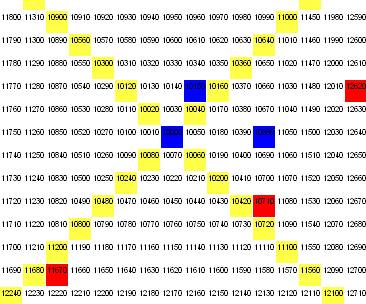
Finally you get the picture like
this (red squares - top price levels; blue squares - bottom price levels):
Square of Nine + ULE module
Now, let me show how to use SQ9 module together with ULE module of the program. The general hypothesis is:
a) the trend changes when two key planets make some aspect;
b) the angles of these key planets point out the price levels.
For example, let us assume that Venus and Jupiter are the key planets for some financial instrument �X�. Consider the moments when Venus and Jupiter make any of Ptolemy aspects in Heliocentric zodiac.
In ULE window, create this event:
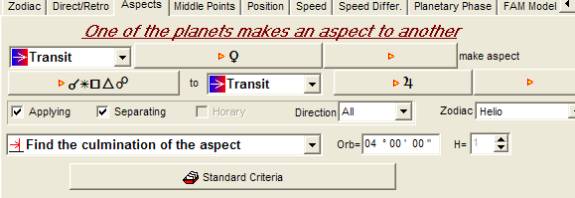
After the calculation, you get this:
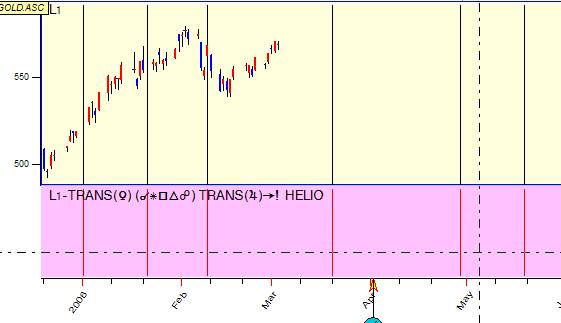
The red stripes correspond to the moments of this aspect�s culmination.
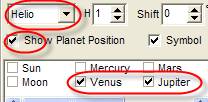
Run SQ9 module, set Venus and Jupiter planets and Helio zodiac (run SQ9 module through Tools/Techniques menu):
Now in the Main screen click the mouse on one of the red strips (that is the moment of the exact aspect). You will get this:
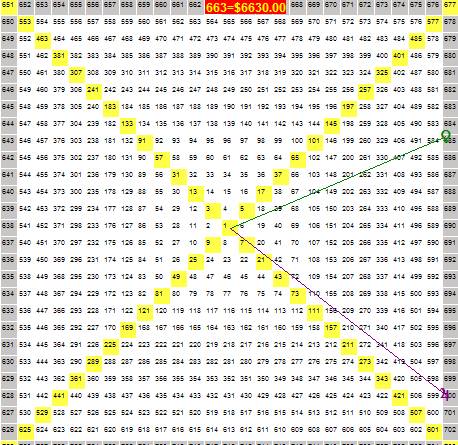
These two lines point at the price targets according to this theory.
Example
There is one more example of employing SQ9 chart. I did not make a special example here as my purpose was just to demonstrate how to realize the most typical approaches of using SQ9.
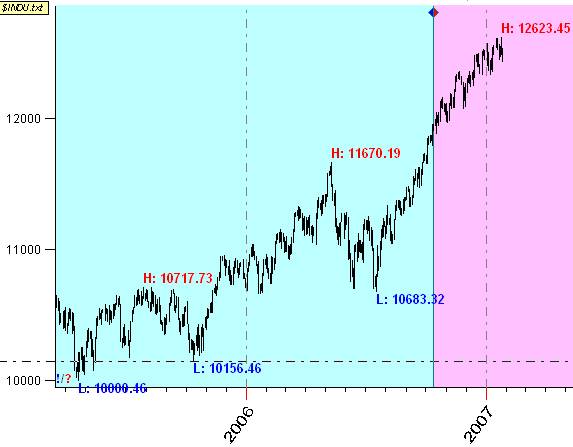
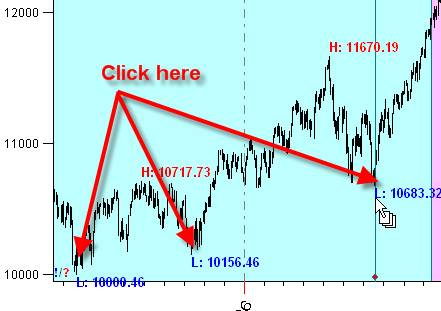
This is a piece of the price chart for DJI:
 �
�
You see there is Low $10000.46 that took place at the end of April 2005. Let's use this price level $10000 as our starting point for SQ9 chart. We will look for the next turning points here. We will use step=10.
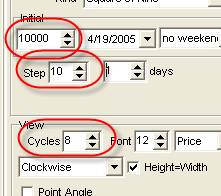
Set these parameters - initial value, step and amount of cycles:
 ����������
You get this table:
Now we need to mark already known turning points.
Start with the bottoms. Just set this option to define a mouse action:
Click the mouse around major bottoms:
The program puts these prices on SQ9 table:
Then catch top points in the same manner:
Finally you will get this:
I do not see any pattern here. Do you? Still, we can try playing with time distances between the turning points.
First of all, set the initial date:
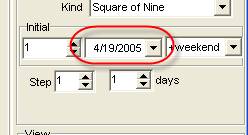
In our example, we set the initial data (4/19/2005) and the step (which is set to 1).
Set the amount of cycles to 14:
 �
�
We need more
cycles because we need to have enough cells to calculate the time distance.
Now let�s catch the dates of bottom/top points and put them on the table. Choose this point:
 ,
,
then in the Main screen click the mouse around major bottoms.
I got this picture:
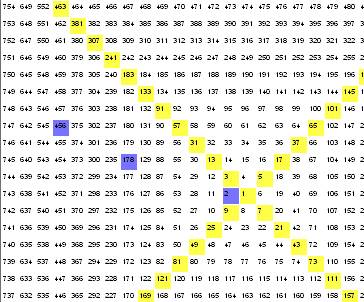
As you see, we get a hint: these three bottoms are located at the same line (I did not find a similar pattern for the tops).
I think the central idea of Square of Nine technique is to find some regular pattern in location of top/bottom points on the SQ9 chart.