Smart snap mode in Timing Solution charting tools
Here we introduce the new "Smart snap" technology that allows easy and fast creation of your own charting tools.
Let's start with the simplest example:
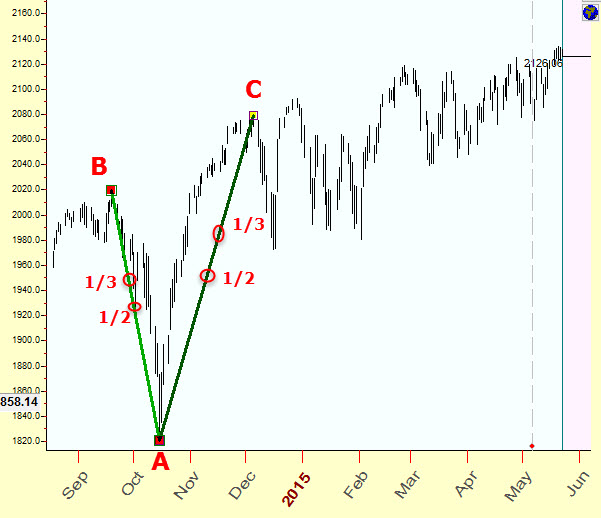
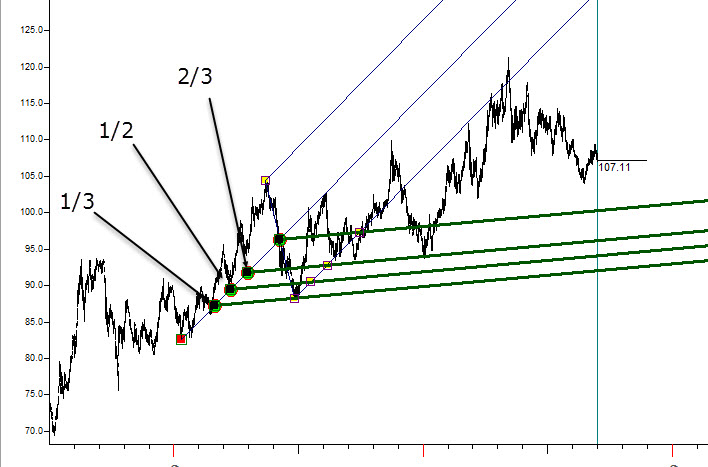
We draw two trend lines, AB and AC, connecting three turning points. Here they are:
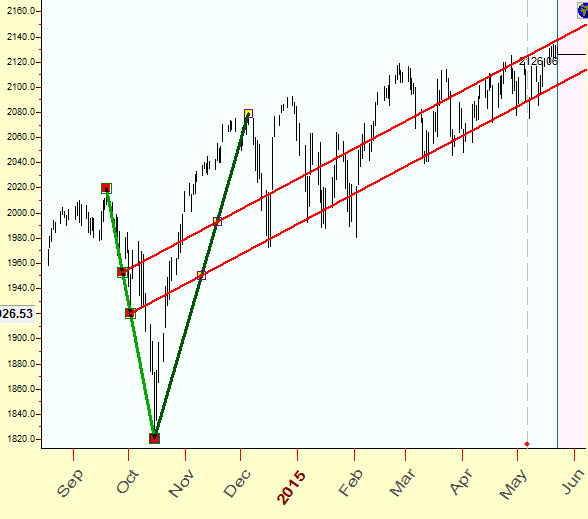
Then we calculate midpoints (marked by 1/2) and one third points (marked by 1/3) and draw two lines that connect 1/2 and 1/3 points. Here they are:
Please watch this short video; it explains how to build this charting tool in seconds: click here to watch video
What is new is that now you can do it by some clicks, without spending your time on complicated calculations. We simply build this charting tool like kids build their things with Lego constructor. The analogy with Lego is pretty straightforward: we provide some environment where you can build a lot of customized tools.
Technically it works this way: while you draw your charting tools, watch these small green circles. The program is showing you active snap points:
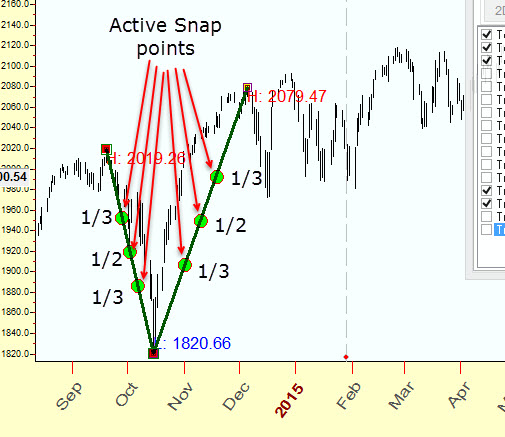
These active snap points correspond to potentially important points, and they can be used while you are building your charting tools. In our example, these are mid points and one third part points. While you move the mouse cursor around these active snap points, the program "catches" them automatically and sets the mouse cursor EXACTLY to these points, i.e. in our case to the lines to mid points or one third points. So you can easily draw the line that connects two midpoints by simple dragging of the mouse cursor from one active snap point to another. The program automatically sets to exact positions, and all calculations are conducted while you move the mouse cursor.
The advantage of this approach is: using these potentially important points, you can build your own charting tools. Like with Lego: using simple parts allows to build very complicated objects.
Let's look at more examples. Do not take them as trading advice, this is a demonstration of charting technology.
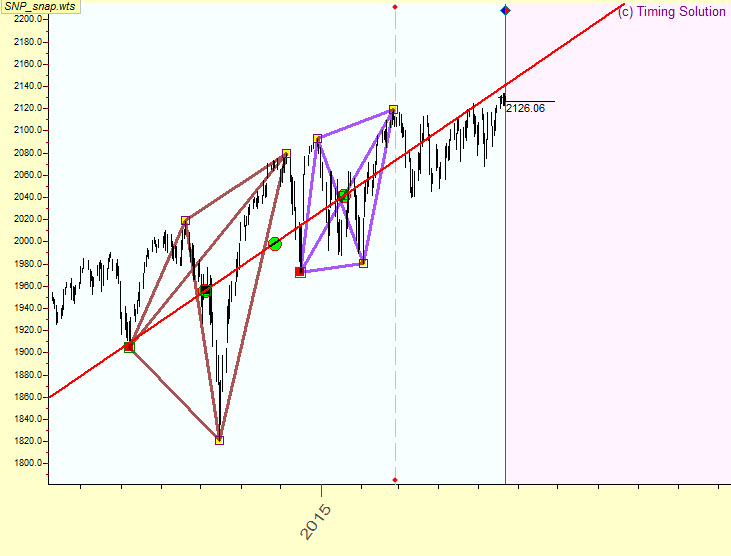
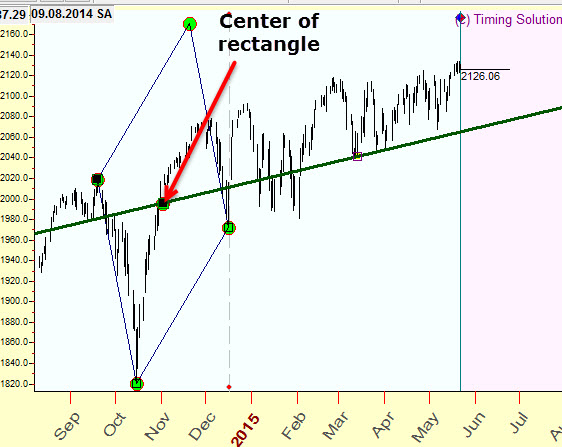
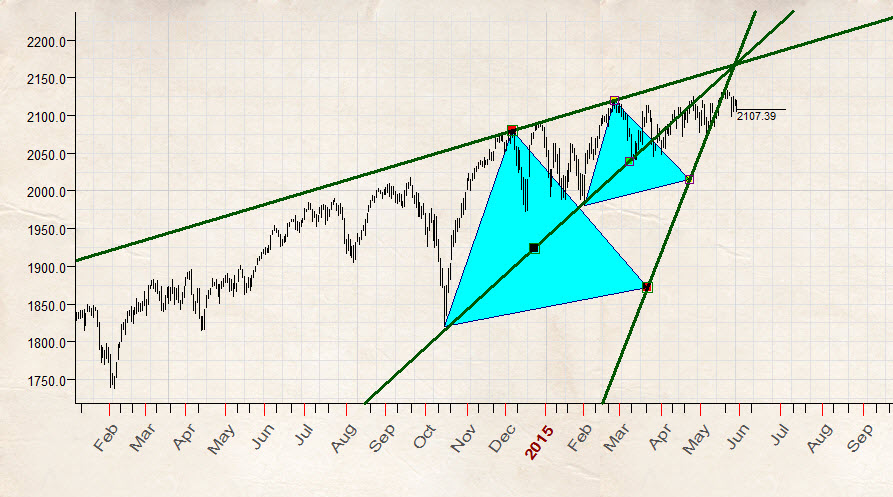
Using standard charting tools, we can draw two triangles based on important turning points. While you do the charting, the program shows potentially important points (important from a geometrical point of view) - triangle centers:
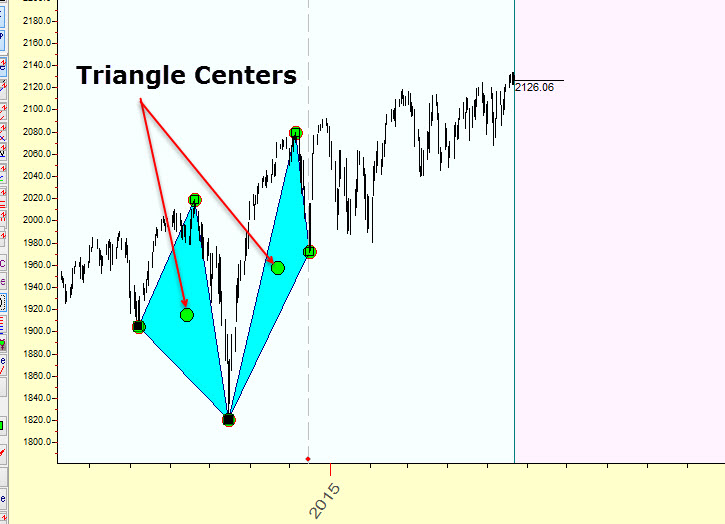
Now you can easily draw a trend line that connects two triangle centers:
I have no idea how to do that using a conventional charting approach. This short video show how to do that within 15 seconds:
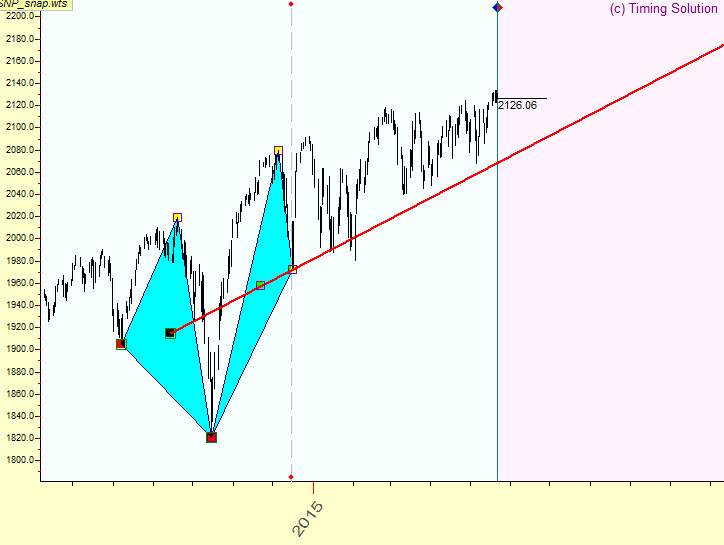
Here is another example. We draw a pyramid charting tool that connects four important turning points:
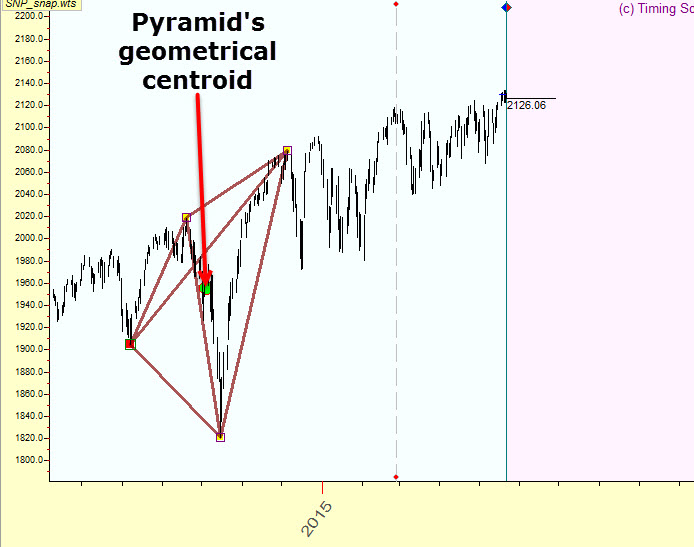
The center of this pyramid (geometrical center) is called centroid. We draw two pyramids and draw trend line that connects their centroids, here it is:
So the core of this approach is: while you do the charting, the program shows potentially important points on the price chart (important from a geometrical point of view). You can use these points building your own charting figures, creating your own market geometry.
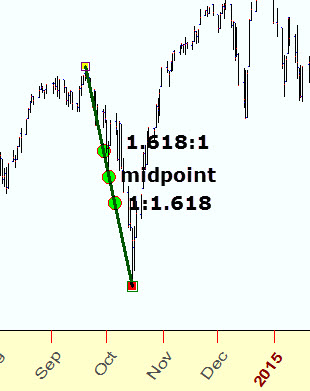
Let's discuss more active snap points for trend lines. There are several possibilities there. We can build figures like that one:
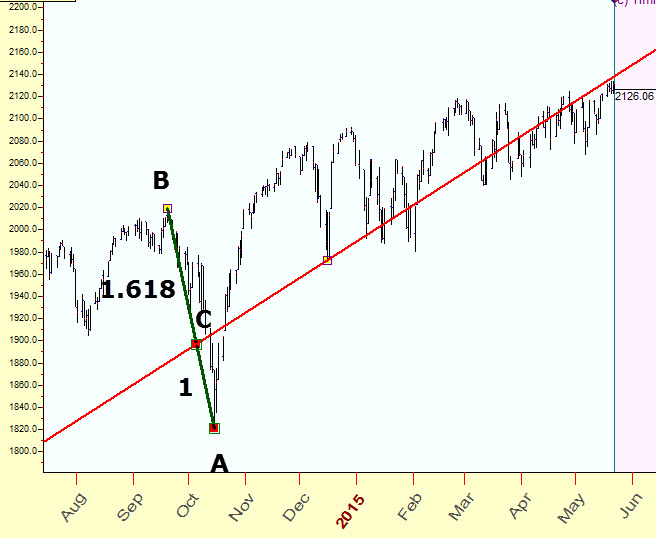
This is how we can do that. Draw the line AB that connects two turning points and calculate the point C on this line that divides the line onto two intervals according to the ratio AC/BC=1/1.618 After that we draw a trend line that connects our golden ratio's point C and the bottom turning point at the end of December 2014.
In order to activate golden ratio points, open "Charting Panel" and in "Snap mode" tab set on golden ratio item:
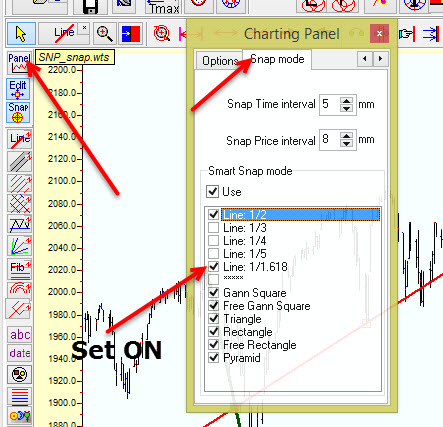
Now active snap points for our trend line look this way:
See below several assorted examples how this new snap feature can be applied:
based on center of rectangle:
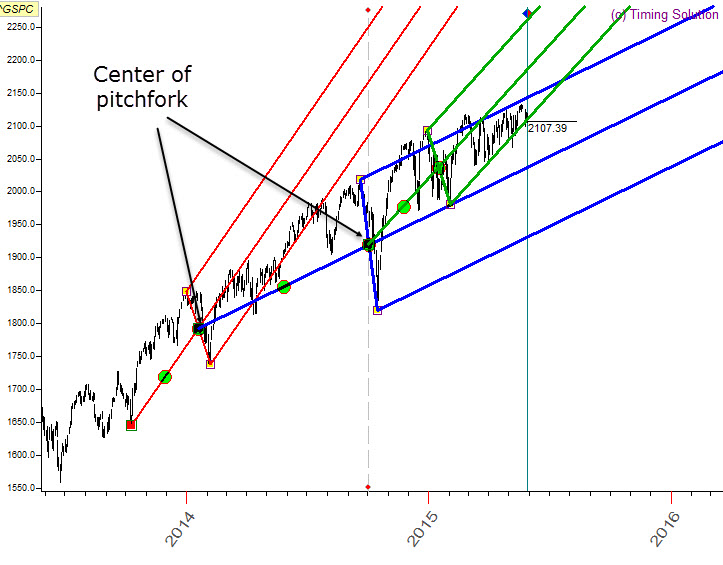
based on Andrew's pitchfork active snap points:
based on center of Andrew's pitchfork:
with precise charting module build equilateral triangles (explained here http://www.timingsolution.com/TS/Articles/Equilateral_triangles/ ) and raw trend lines based on these triangles, kind of rising wedge:
Sergey Tarasov
May 23, 2015
Toronto, Canada