Application of basic statistics in Timing Solution
written by Sergey Tarassov
In this small article I will explain the usage of statistical criteria in Timing Solution.
Efficiency Test module
This module is used to research the effect of any astronomy/astrology phenomenon on the stock market movements.
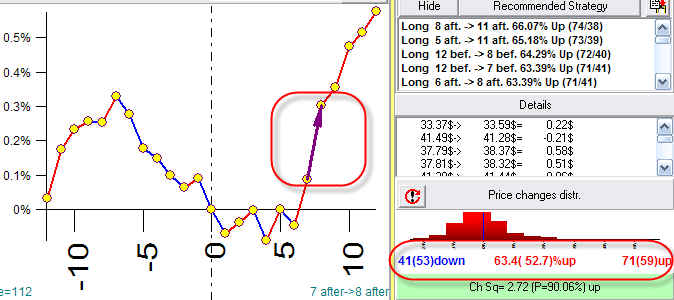
For example, doing the research for the Sun - Jupiter conjunction, you can see that Dow starts its uptrend movement in a week after this conjunction:
The arrow and the record in the lower right corner shows us that a week after the conjunction the price has gone up 71 times against 41 times down. It looks like we have found a factor that causes the upward movement. The question is: "Can we accept this factor as a really meaningful one?". In other words, we need to know whether we should consider this factor or not.
The science of statistics can help here. Immediately it gives us the answer: "No, it is not enough information to make such a conclusion; we need to conduct some additional research". Before taking this factor (the Sun - Jupiter conjunction) as the up-mover, we need to be sure that there is no upward movement when this aspect is not present. We need to ask ourselves how many times the Dow would go up if we disregard this aspect. If Dow goes up with the same or greater pace when there is no such aspect in the sky, our result above is not a mover itself, it just coincides with some other factor that we do not know yet and that is a real mover. To find out that, we create a so called "control group". We randomly choose 112 points (112 - because in our example the Sun - Jupiter conjunction has occurred 112 times) and look how this random "aspect" (as there is some aspect for each of 112 points) "affects" the stock market. The program shows that for this aspect the price went up 59 times against 53 times down. You see all this info on the screen: figures "71" and "41" show the results for the analyzed aspect while "59" and "53" refer to our control group. Thus we are able to apply the "Chi square" statistical criterion:
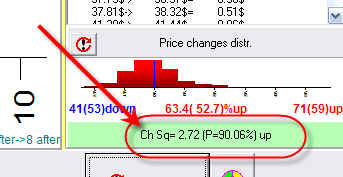
It says to us that the factor that this aspect moves the market up is not occasional, and the probability of this non-occasion is 90%. Also, it means that there is 10% possibility that this fact is occasional and this aspect has no effect on the stock market. This 90% is a probability to be true. Do not not mix it with the force of this aspect - which may be not so impressive as we have 71 times up and 41 down, i.e. the price went up in 63% of cases.
Correlation in ULE and Neural Network modules
One more application of the statistics is correlation analysis of ULE events:
ULE module helps to record events that we believe move the market. Then we create a projection line based on those events. And we can compare the projection line to the actual price (or price modifications/oscillators).
You do not need to do the comparison; the program performs this analysis. As the result, you get the info window similar to this one:
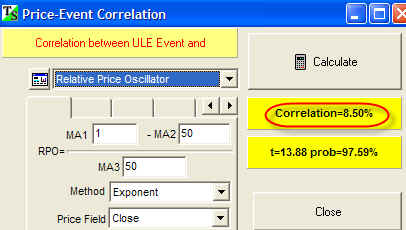
In this particular case, the program says that the ULE event that we research correlates to the relative price oscillator (period=10 bars) at 8.5%. You can find the description of correlation coefficient in documentation.
I would like to explain how to use this info: ![]()
It is very close to the probability to be true that has been discussed above. If we have a small price history file, we might get a huge systematic error even if the correlation coefficient is high. As an example, we could have 80% correlation between the projection line and our forecast on the last 100 price bars. But we cannot be sure that this result is not occasional. To be sure, we need to use much more price history data. To estimate how we can rely on this fact, we use t-statistic. In this particular case we have:
force of this phenomenon is 13%
its probability to be true is 97.59%
Do not mix these two parameters.