Turbo Cycles module in Timing Solution (Advanced version)
Upgrade July, 2008
This module allows to create quickly a projection line based on fixed cycles. The peculiarity of this module is that it allows to perform this work extremely easy. This module works fantastically fast because I used the new algorithms here.
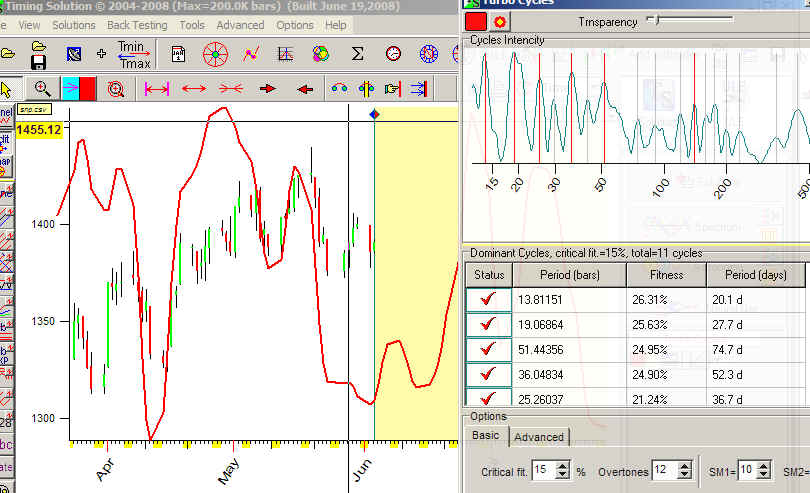
Let's start with some example. I have downloaded the price history data (S&P 500 daily) and run this module ("Advanced"->"Turbo Cycles"). Immediately after doing this, I have get this projection line for S&P500 (a red curve in the Main screen):
The program shows the most active cycles that worked recently. For this example, the program shows five most active cycles: 13.8, 19.07, 51.44, 36.05 and 25.26 bars. The red projection line is a composite of these cycles
If you need to get the final forecast (the forecast based on the model that
uses the WHOLE available price history), simply set Learning Border Cursor
(LBC) on the last price bar clicking this button 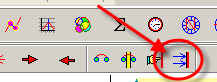 ;
in a second the program will perform a huge amount of calculations and will update the
projection line.
;
in a second the program will perform a huge amount of calculations and will update the
projection line.
Now let me explain what the program does during this second.
First of all, to generate the projection line based on some cycles we have to find these cycles. So the program does it; its multiframe spectrum algorithm performs this task perfectly. You can see the cycles activity in the upper part of the window. The peaks on this diagram (its other name is spectrogram) correspond to the most influential cycles:
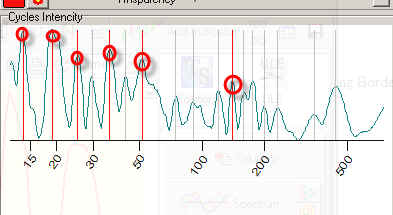
Look how the spectrogram is changing when you change the position of LBC.
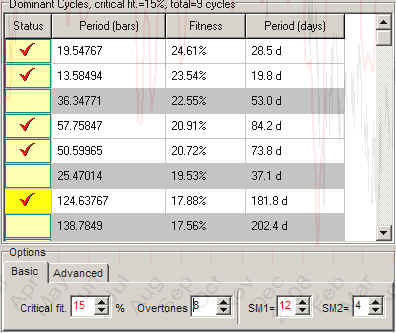
Next step is presented in the middle part of the window. The program extracts the most important cycles:
It displays a period for each cycle and some other parameter, "fitness". This parameter is a forecasting ability of this cycle. ("Fitness" for multiframe spectrum corresponds to Bartell's significance test for classical spectrum analysis.) The higher fitness value, the more significant cycle is.
To generate the projection line the program uses 5 of the most powerful cycles (it is set by default). You may exclude any of them or add more making a double click before each cycle:
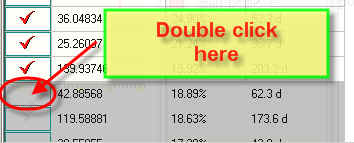
The program immediately updates the projection line taking into account a new cycle (42.88 bars cycle shown).
This part of the window contains parameters you can vary:
Critical fitness - allows to choose the cycle by fitness criteria. If you set this value to 50% you will get 1-2 dominating cycles. I recommend to vary this parameter in the range of 5-25%.
Overtones - allow to include sub harmonics to the main cycle. For example, if we analyze 100 bars cycle and use four sub harmonics, the program will analyze 50, 33.3 and 25 bars cycles together with 100 bars cycle.
SM1 and SM2 parameters. These are special parameters for multiframe spectrum algorithm. Try to vary them in the range of 3-20
Remember that setting SM1 parameter to 2-3 gives the spectrum very close to MESA (maximum entropy spectrum) , while setting SM1 higher than 30 gives the spectrum that is very close to classical Fourier transform. Multiframe spectrum lies between these two; it is the best compromise between the noise (Fourier) and the concentration on short term cycles (MESA).
SM2 parameter is responsible for forecast horizon. If you set this value small (1 - 4), the program will concentrate on a short term forecast; increase this value to create a middle term forecast.
Under "Advanced" tab, try to vary only these two options:
Target - this is what we try to forecast. For example, you can try to forecast RSI, ADX, volatility or any other index. See below the screenshot of the forecast for RSI (the bottom part shows RSI index itself):
Max amount used dominant cycle - shows how many cycles the program uses to generate the projection line. As I said above, you can include/exclude these cycles manually. Though I do not recommend to use too many cycles.
Working with this module you mostly vary Overtones and SM2 parameters and add/exclude new cycles. These parameters are the most influential. The working desktop looks like this:
Also pay attention that when you change the parameters marked by red font (Critical fit. and SM1)
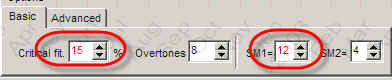
the program recalculates the periods of dominant cycles automatically.