There is something that we would like to share with you. Recently we have found unique data for the analysis; these are yearly data for wheat prices in Britain starting from the year 1259. It is almost 750 years of historical data, the longest historical data set for commodities. This is a good opportunity to apply Timing Solution software.
The brief analysis already shows that the Saturn-Neptune cycle is pretty strong for wheat prices. However, there is one fundamental factor related to this cycle: the existence of 36- year drought cycle.
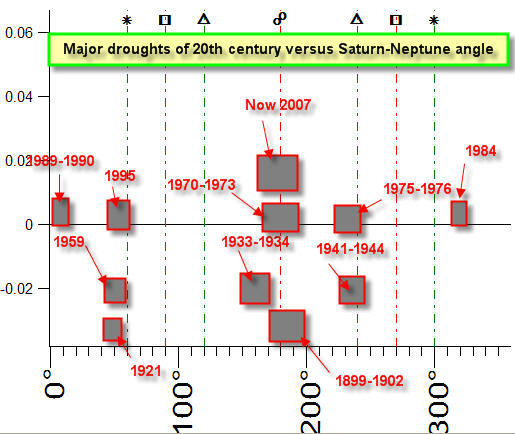
See on the diagram below 11 major droughts of 20th century in respect to the Saturn-Neptune angle:
You definitely can see two major clusters in the graph:
1) Near Saturn-Neptune's angle of 180 degrees, separating; it corresponds to droughts in 1899-1902, 1933-1934, 1970-1973 and now (2007);
2) Around Saturn-Neptune's angle of 50 degrees, separating; it corresponds to the droughts in 1921, 1959, 1995
In any case, droughts tend to occur near Saturn-Neptune oppositions, which is not surprising as it corresponds to the astrological meaning of this aspect. It is likely that this aspect will push the price of wheat.
Here is the detailed analysis of Saturn-Neptune cycle versus the 750 years price history of wheat. The composite diagram looks like this:
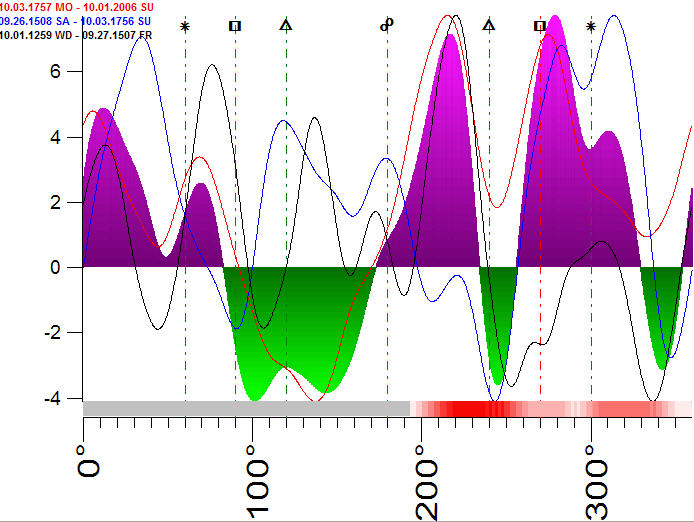
The diagram represents the effect of this cycle calculated for all available 750 years of wheat price history. To be sure that we deal with consistent information, let us divide our price history onto 3 equal intervals, 250 years each. You can see on the diagram above three thin curves; a red curve is the composite calculated with the use of the data for the years 1757-2006, the blue one is for the years 1508-1756, and the black one is for the years 1259-1507. If all these three curves point in the same direction, we can assume that the effect of this cycle is consistent. Looking at this diagram we can state that the effect of this cycle in the 20th century is the same as in 13th century, especially after the opposition (i.e. when the angle between Saturn and Neptune is between 180 and 360 degrees).
Note that the average high for the price of wheat has been at the 220-degree angle, 40 degrees (about 4 years in time) beyond the opposition. This suggests that the effect of drought, which has tended to occur at the 180-degree angle, puts upward pressure on price of wheat for approximately 40 degrees or about 4 years.
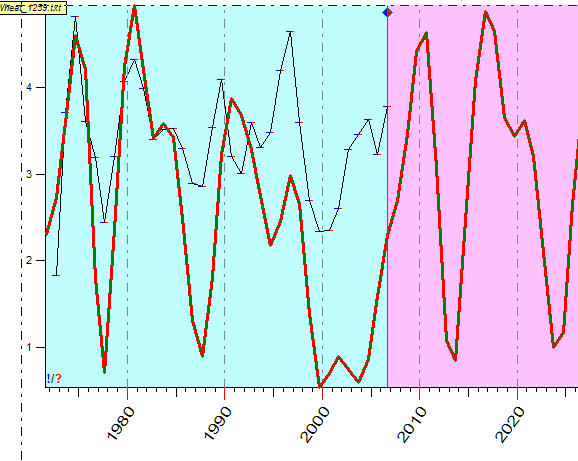
This is how this cycle appears in recent times:
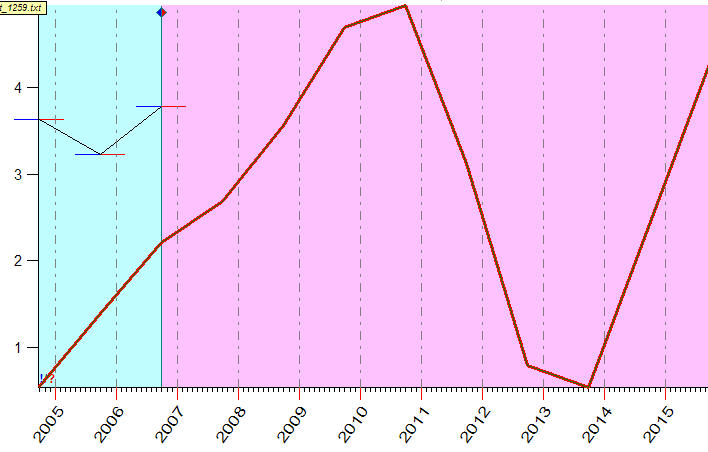
We can make the projection line for wheat in the smaller time frame:
To finalize this brief research inquiry, we have calculated the spectrum for wheat price (to eliminate the trend, the relative oscillator with a period of 20 years is used). The spectrogram allows to reveal the strongest cycles within the data set. The peaks on this diagram correspond the most strong cycles. The higher and more narrower peaks correspond the more strong cycles (so called "quality" of cycle). This diagram looks:
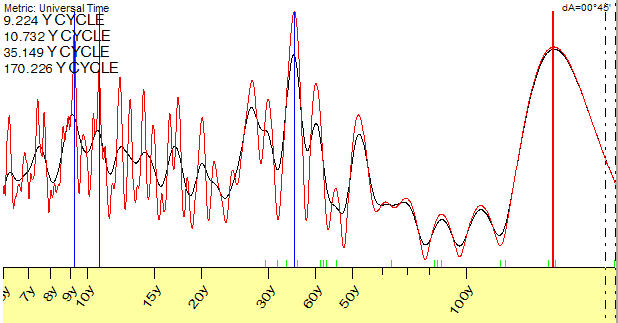
We can see here:
9-year cycle: possibly related to the 9-year-Juglar cycle;
11-years cycle: obviously the sunspot activity cycle is involved; it has its impact on corn prices (discovered by William Herschel in 1801);
35-years cycle: looks like this is our Saturn-Neptune cycle;
170-year long term cycle: may be it is related with the 165-year Neptune cycle.
Vienna, Austria
Toronto, Canada
July 2007