Saga about trend lines - working with proportions and angles
In this class I will show what you can do using the simplest charting tool "Trend Line" in Timing Solution.
Basic properties
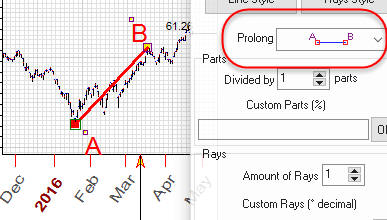
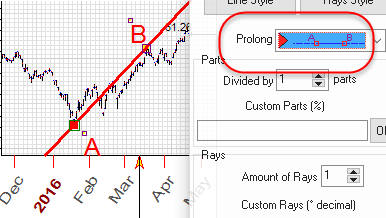
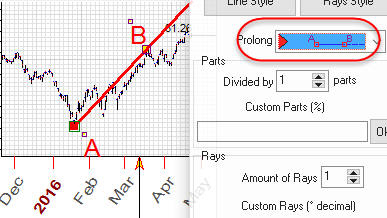
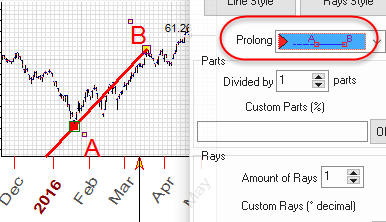
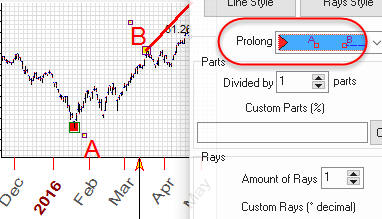
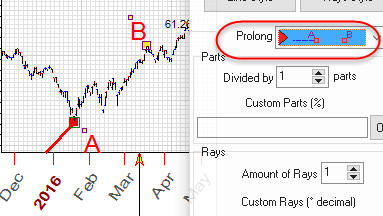
You can set color/thickness/style of your trend line using "Line Style" button. Also "Prolong" feature allows to draw this line regarding anchors A and B differently. Look how the trend line changes while you modify "prolong" option:
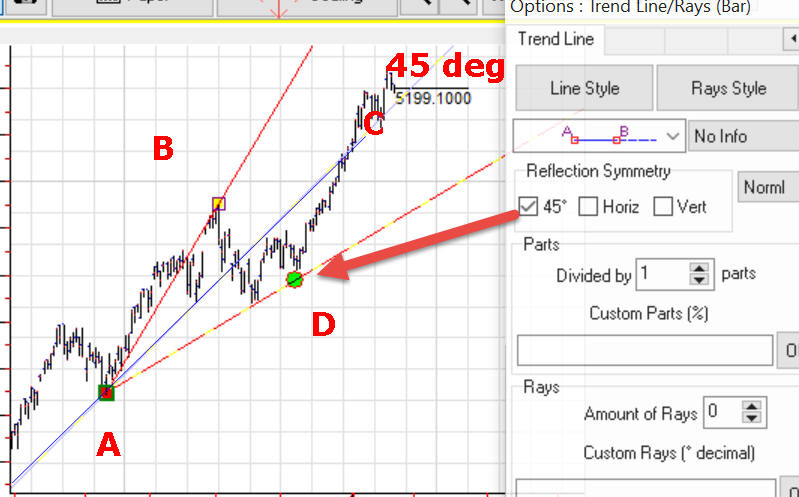
Reflection symmetry
To reveal symmetrical patterns, you can use "Reflection Symmetry" features. For example, having the trend line A-B you can build another trend line A-D that represents symmetrical reflection of initial trend line A-B regarding 45 degree trend line A-C. This 45 degrees trend line is called "axis of symmetry":
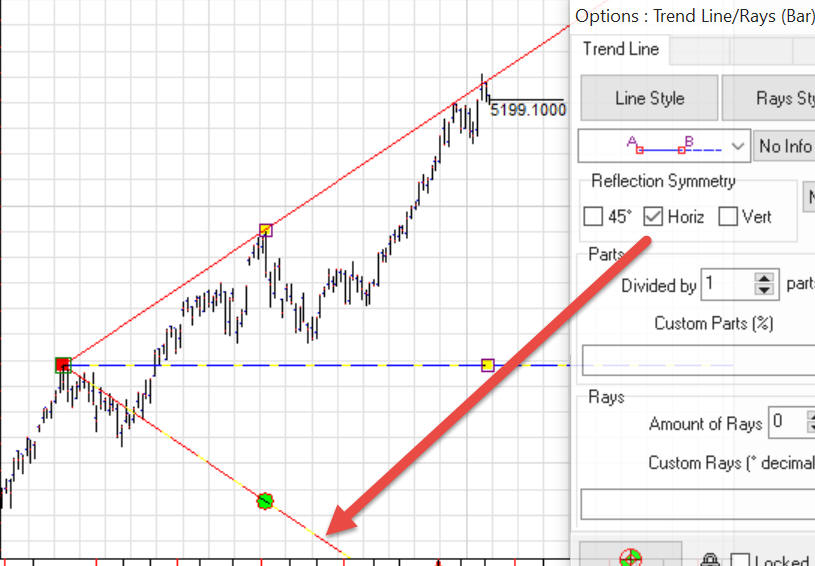
The same manner we can use horizontal symmetry (horizontal line as axis of symmetry):
or vertical symmetry:

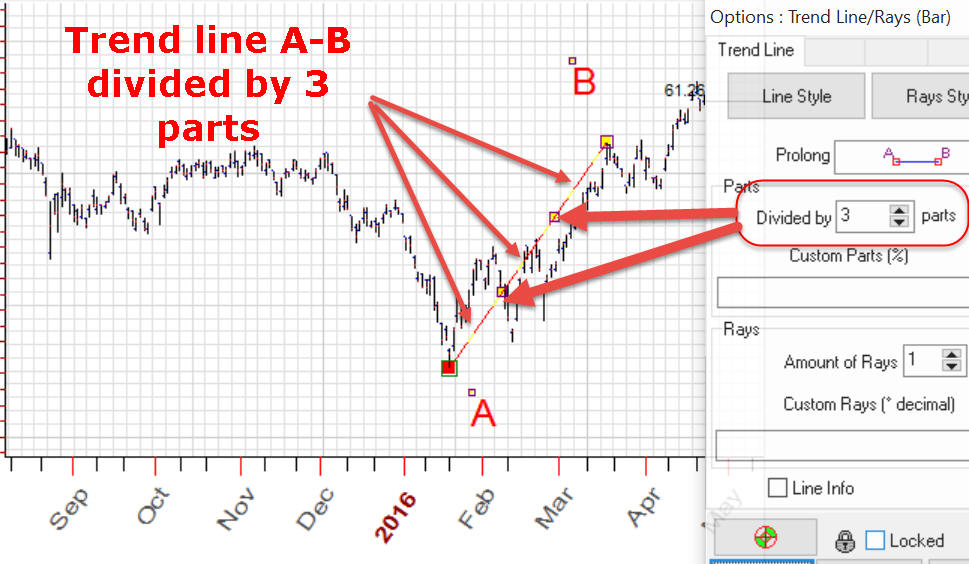
Parts - working with proportions
Now you can divide the trend line on a certain number (%X) of equal parts. The chart below shows a trend line divided on three different parts:
Why do we need this? These points can be used as snap points to build more complicated geometrical figures. As an example, we can easily draw another trend line that connects another point C and 2/3 of the initial trend line AB . The program automatically catches these points while you move the mouse cursor around them:
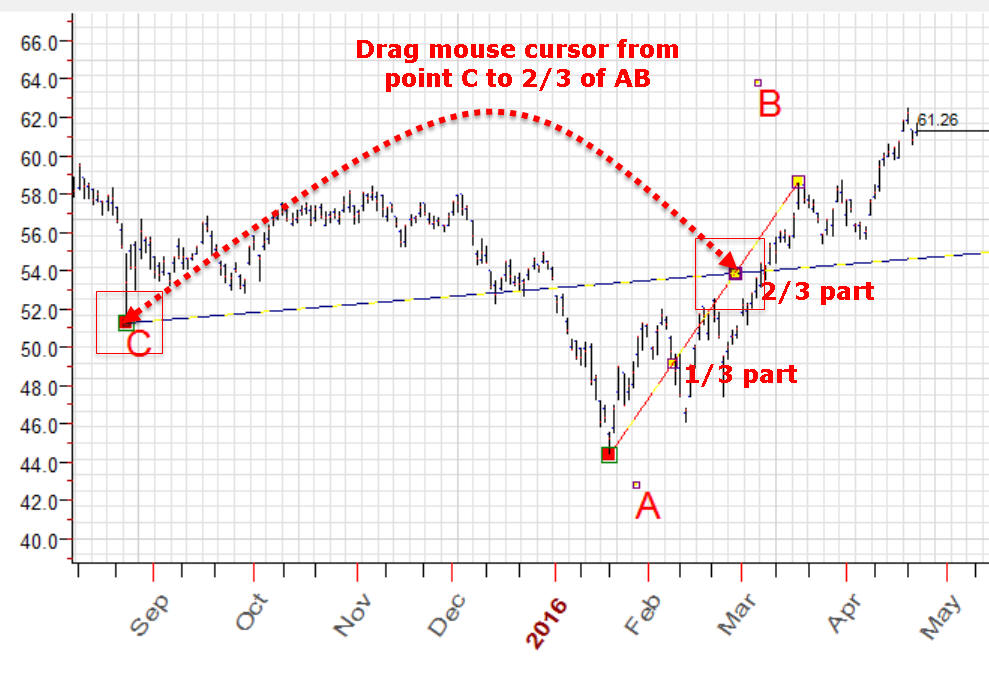
You can see here how to do that:
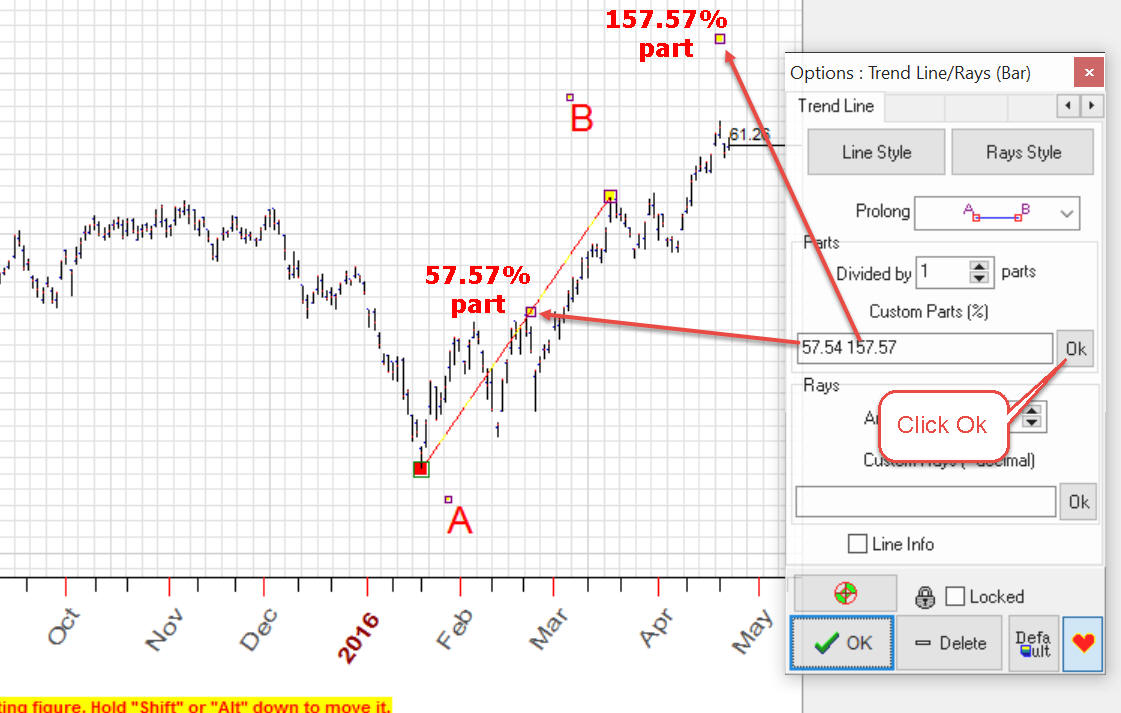
Moreover you can specify these parts manually. For example, this way you can specify the two parts, 57.54% and 157.57% of AB trend line:
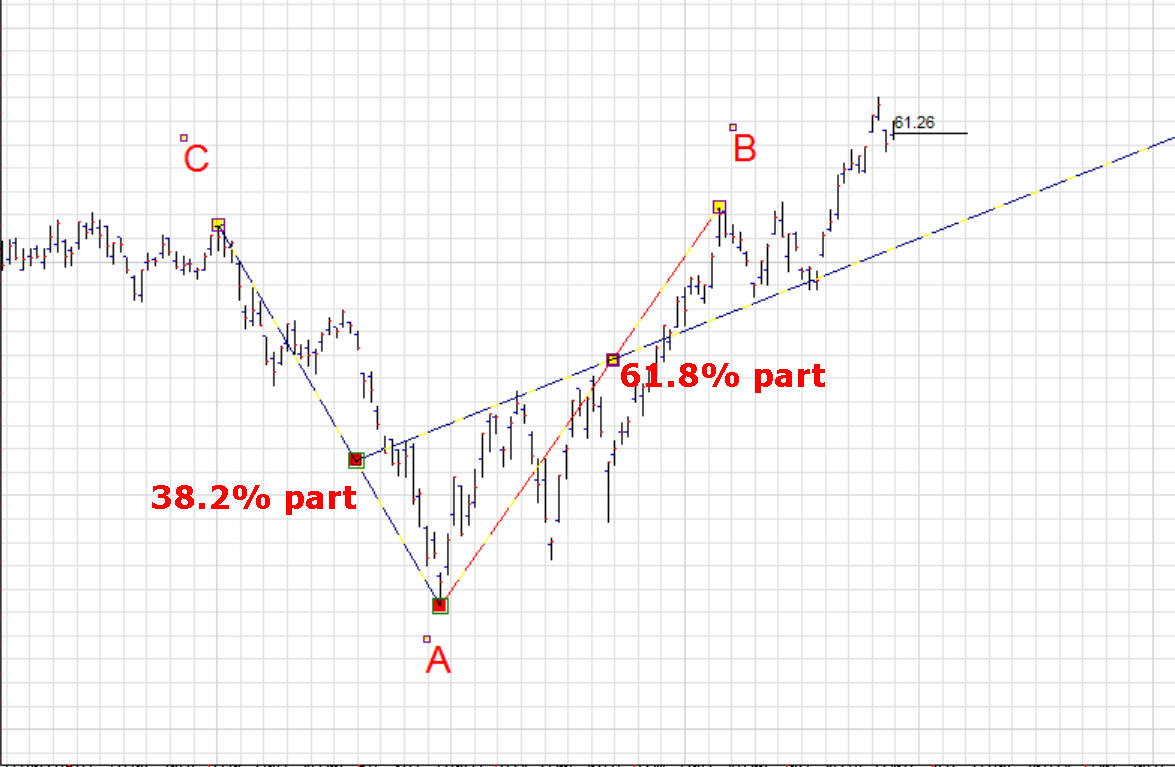
All these parts can be used as snap points, it means that all these parts can be used in your charting. As an example, see how you can build this sophisticated golden ratio based chart:
having two trend lines, AB and AC, build the third trend line that connects 38.2% part of AC trend line and 61.8% part of AB trend line:
This video explains how to do that:
Rays - working with angles
There are also features that allow to work with rays/angles.
Firstly pay attention to setting ON "Line Info"; you will be able to display the information for the trend line:
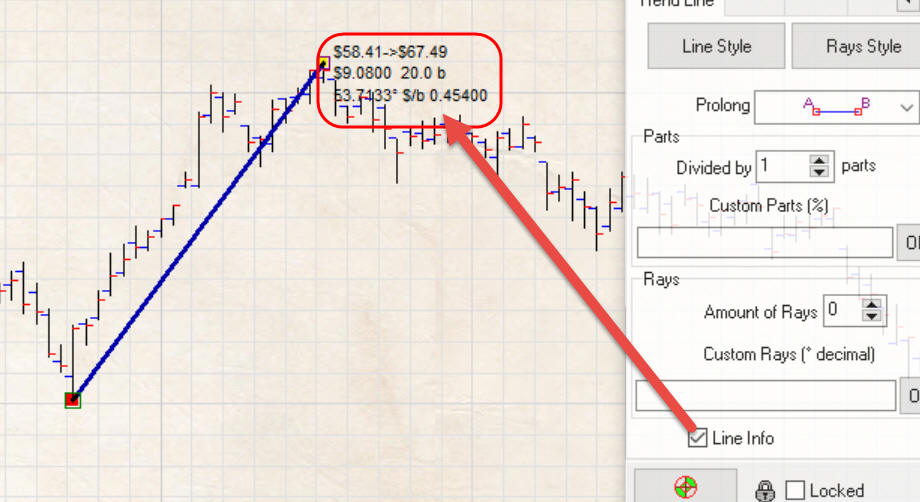
It displays: prices, price change and time change, angle (decimal format) and price to time ratio.
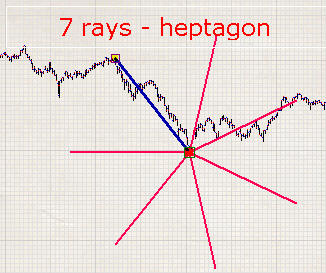
Second, try to set "Amount of Rays" option to some value, let it will be seven:
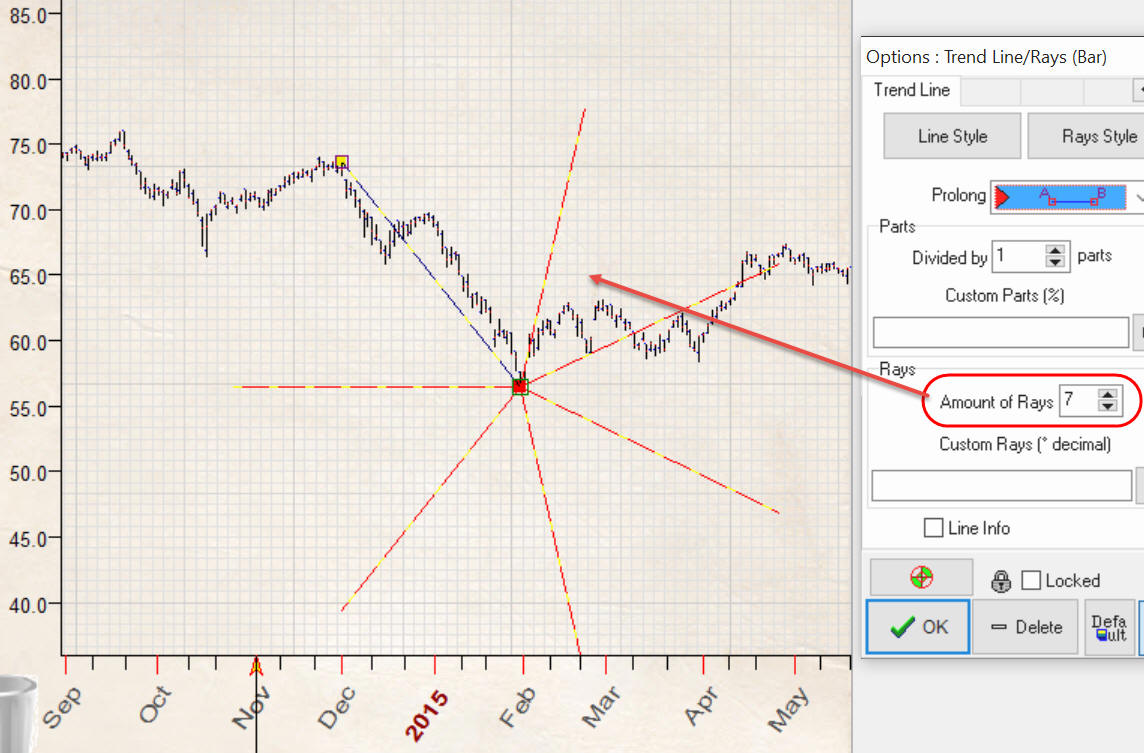
In this case, the program shows seven rays with the same radius as the initial trend line, separated by 51.43 degrees from the trend line; in other words it shows a regular heptagon.
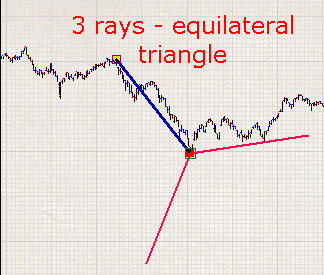
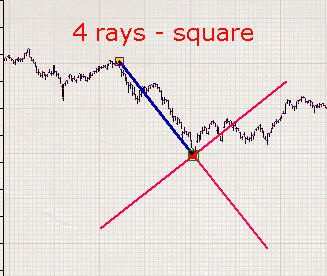
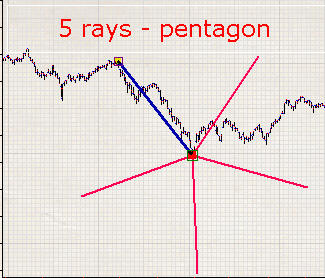
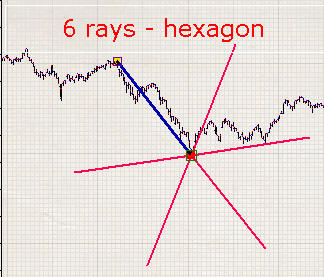
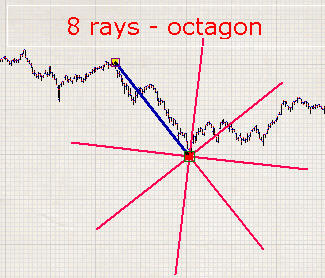
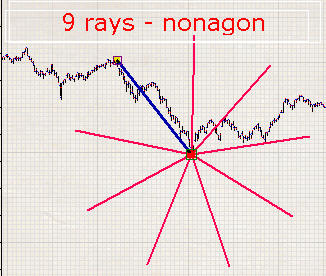
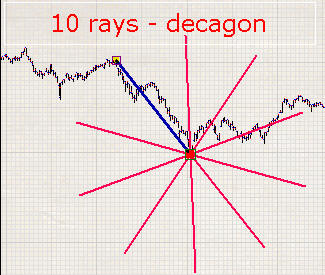
The same way you can build any regular geometrical figures:
Moreover, these rays provide a set of snapping points that can be used in your charting.
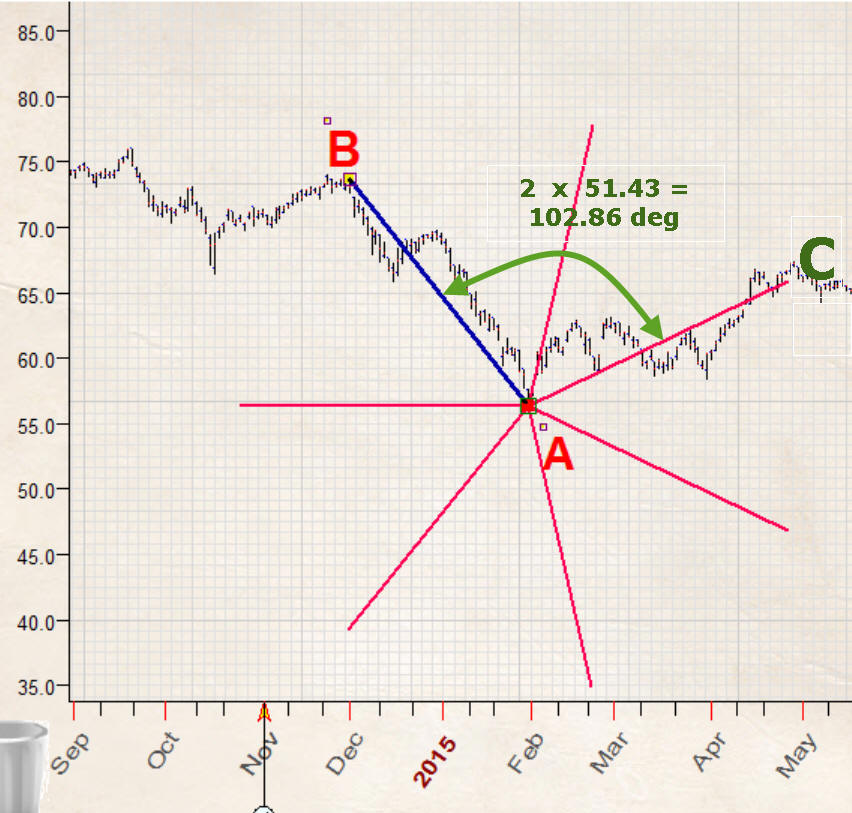
You can do things like the one below (it is not a trading advice): draw a trend line that connects two important turning points A and B and draw heptagon (7 rays).
"Not a trading advice" just because in this random example the 102.86 degrees ray coincides with AC trend line, so let's draw another trend line that connects turning point A and -102.86 degrees ray:
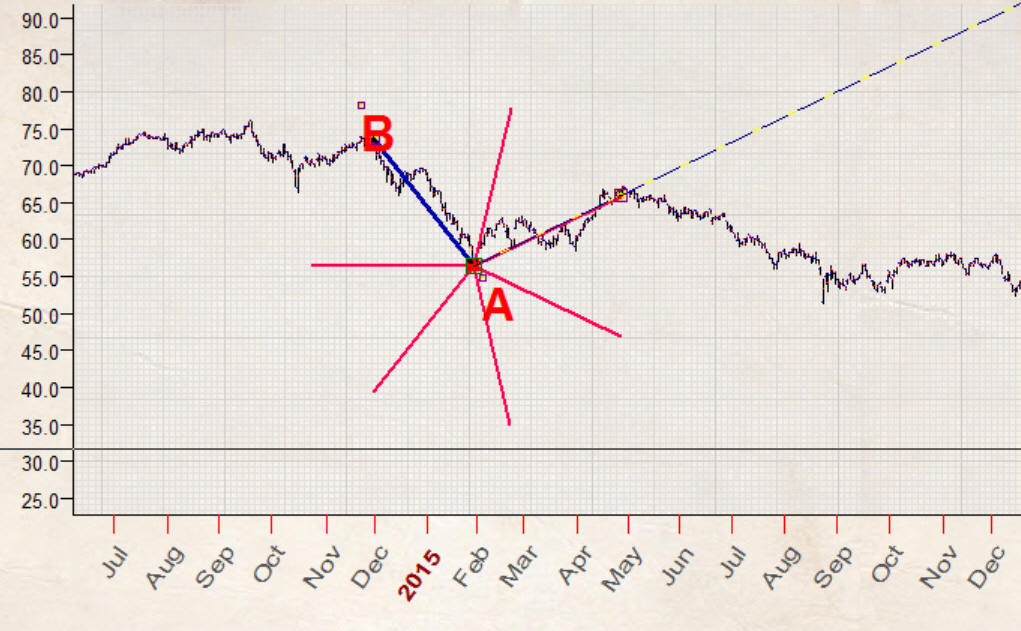
This is how this charting construction looks (once again - not a trading advice as it may or may not coincide with some other trend line):
This video explains how to do that:
Important notice: be advised if you modify paper parameter the rays can hit different places on the price chart. In other words, you may work with ideal figures if your price chart is already properly scaled and you do not plan to change the paper parameters anymore.
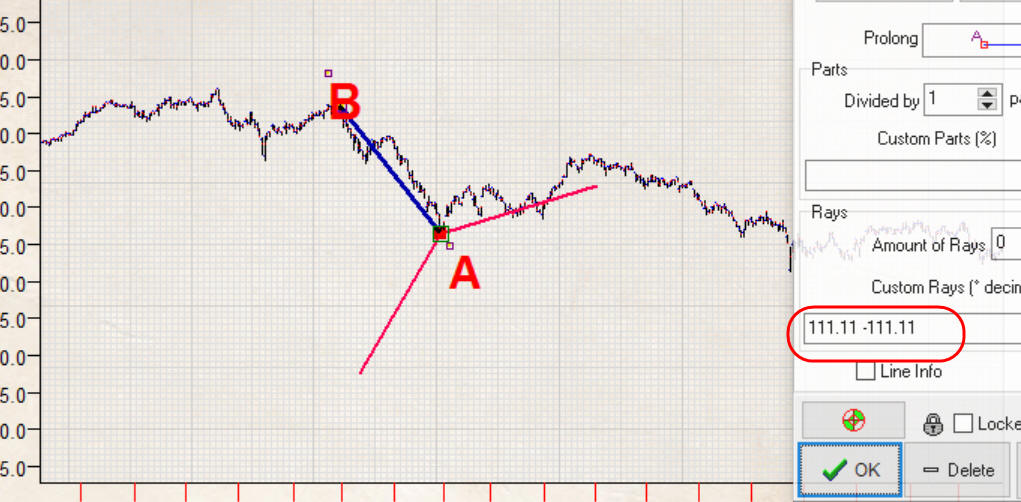
If ideal geometrical figures do not cover your needs, you can specify the angles manually. For example, we want to display some special ray, 111.11 degrees. Simply type 111.11 in Custom Rays control and click Ok:
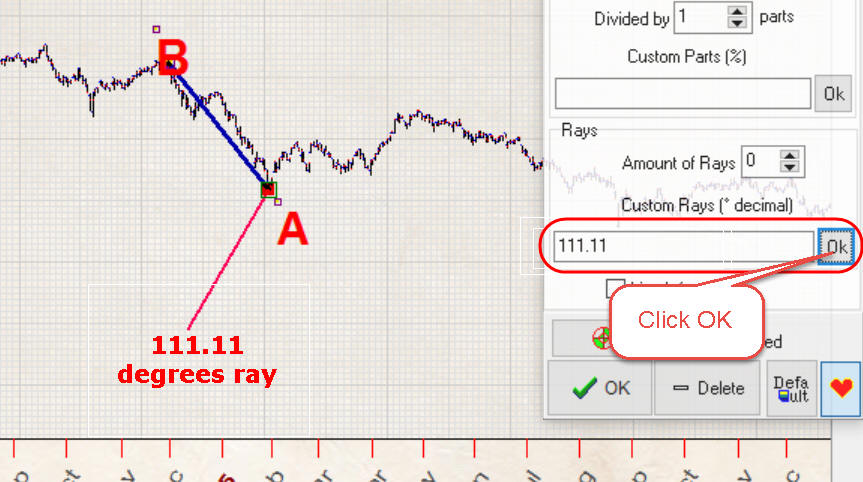
Counterclock angle counting is used here; if you need to display a clockwise angle, use the negative angle value. Here both angles are displayed: