Precise charting with Timing Solution
Computer era gives traders a lot of new possibilities that were practically impossible prior to it. Nowadays, traders do not care about the process of calculating of technical indicators; the programs recalculate them with a fantastic speed, tick-by-tick, as soon as the new piece of price information becomes available. Now we have powerful tools that provide us the opportunity to analyze, to create hypothesis and theories and test them, to think.
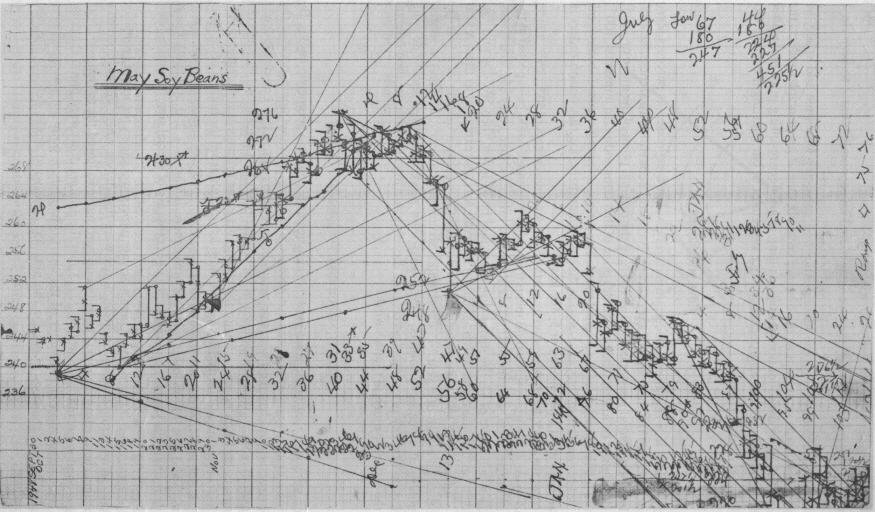
It was not so in the past. The calculation process was very tiresome and time consuming. As for tools, practically all calculations were performed with graded paper, a ruler and a pen. Look at the picture below. This is the famous price chart that W. D .Gann used while trading soy beans in 1947-1948:
Definitely, computers speed up the process. However, there are still some methods used by traders in the past that are not in the arsenal of tools suggested by modern software. Let me explain what I have in mind. I will show it using some example.
Look at W. D. Gann's chart above. Most of the lines drawn by Gann keep specific proportions based of the grid scale. For example:
1 horizontal unit of the grid = 1 vertical unit of the grid, this is 45 degrees angle;
2 horizontal units of the grid = 1 vertical unit of the grid, this is 26.25 degrees angle, etc.
Gann called these lines "Geometric Angles".
The question is - "How to draw these lines with Timing Solution?".
The most common mistake is to draw 45 degrees line (as in the example) using the chart displayed on the monitor (like using a scale 1 x 1 pixel). The result is far from what W. D. Gann had. What is wrong? The problem is that there is a big difference between the price chart displayed by the computer and the chart drawn on paper. A computer monitor displays "NOT SCALED" chart, i.e. the proportion (in pixels) between the horizontal and vertical scales is changing when we zoom the chart/print the chart/display the same chart but on some other monitor. This is the price that we pay for the possibility of quick and easy price manipulation that modern programs give to a trader.
Is there any way to deal with this problem? Yes, there is. Now I will show how to draw a true 45 degrees line with Timing Solution. First of all, you have to SCALE your chart. Gann's chart has a horizontal grid cell corresponding to 8 trading days, while one vertical grid corresponds to $4. Below is an example made by Timing Solution software. I used here Dow Jones 1951-1952 as I do not have daily soybeans data for 1947 - 1948. Dow Jones was in 1950s at the same price range ($210- $300) as soybeans in 1947-1948.
Open "Charting Panel" window. In "AutoScale" tab choose "Manually defined" item and type grid scale parameters that will be used (8 trading days/$), then click OK:
This way we actually set the scale that will be used for paper grid:
Now draw this trend line (using the same parameters as Gann's - 1 horizontal unit and 1 vertical unit):
You see this line has a visual slope less than 45 degrees. This is because a computer monitor uses dynamic scale for the display (which is defined by max horizontal and vertical sizes of the image). But - if you will take a paper and draw the same chart with the same proportions for your trend line (8 trading days in 1 inch horizontally and $4 in 1 inch vertically), you will get the exact 45 degrees angle for the trend line.
Exactly in the same manner we can draw Gann Fans, displaying "Geometric angles":
Gann box:
and all other techniques.
You just need to remember that you are not actually using a paper with the grid 1inch x 1 inch (cm, etc.), you use a proportion suggested by Gann (8 trading days X $4). Also, the proportions good enough in 1947 are not so good now; just try to mark levels that Dow has now using that same proportion of 8 trading days and $4. You will understand immediately what I mean.
If you need to display a trend line with another slope, let's say 2 horizontal units of the grid X 1 vertical grid = 16 trading days X $4, set these parameters:
There is also a possibility to make a price chart displayed on the monitor similar to the price chart on paper.
You need to calculate the ratio between vertical and horizontal grids size. If we have horizontal unit size=8 days and vertical unit size=$4, the ratio is 4/8=0.5. Remember this value 0.5.
Now try to resize the window size and watch the digit that is displayed in the left bottom corner:
This value should be as close to our 0.5 value as possible. You see that exact 45 degrees is now on the monitor.
BTW, if you work with trading days, before drawing the charting tool, choose BAR option, if calendar days - TIME:
Besides "Geometrical Angles", Timing Solution has a possibility to draw astro based charting tools.
Here are astro based trend lines; they are based on slow planets motion (the scale used has 1 degree of planetary movement=$10):