Support/Resistance Lines in Timing Solution
In October 31, 2006 upgrade, the new charting tool is presented � �Advanced Support/Resistance�:
This module allows you to draw a great
variety of different price levels (support, resistance, pivot points, equilibrium
points). You can easily create any price level calculated by some special way.
Moreover you can perform the visual back testing of these levels to figure out
how these price levels work.
Let me show the abilities of this module.
Suppose you need to analyze some piece of price history. It may be a week, or 3 weeks, or several years; the program is able to deal with any time frame.
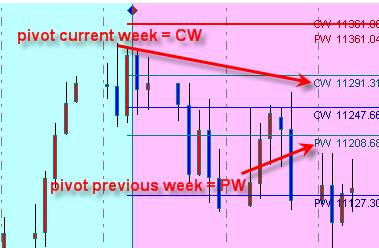
You would like to calculate the pivot (balance) point for this price history interval. Here it is: HLC=(Highest High + Lowest Low + Last Close)/3
Then you may calculate the support level as 2*HLC-Highest High and the resistance level as 2*HLC- Lowest Low. These are the most popular levels.
You can do it very easily with Timing Solution:
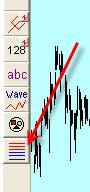
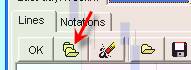
1) Click on this button ![]() ;
;
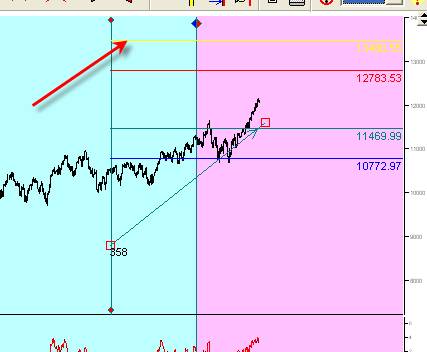
2) And drag the mouse covering the interval for your research:
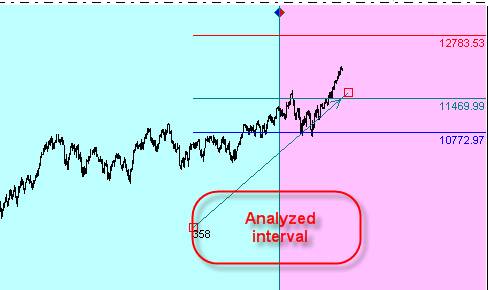
The program automatically will perform all necessary calculations. In other words, it will find the highest high and the lowest low points for this interval and then make the math calculations. The picture above shows these levels as teal, red and blue lines. The arrow shows the analyzed interval; figures at its beginning mean the number of price bars covered by this interval (358 in our example):

The important thing to remember is that any
time you modify this interval (the arrow), these levels will change as well.
Now look at �Properties� window for this charting tool:
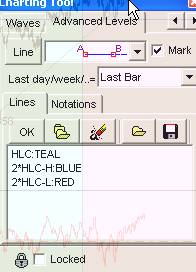
This edit box shows the lines we draw.
The line
HLC:Teal means that the program draws the pivot point = (Highest High + Lowest Low + Close)/3 for the analyzed interval. To display this line, the teal color is used.
Next line, 2*HLC-H:Blue, means 2*Pivot-Highest High line displayed as a blue line.
And the last line is the red resistance line, 2*Pivot-Lowest Low.
The variety of support/resistance lines is huge. What if you would prefer to work with your own line? You may would like to calculate the resistance line as Pivot + Highest High + Lowest Low and you may like to see it as a yellow line. Not a problem; it is very easy to do. Simply type this and click �OK� button:
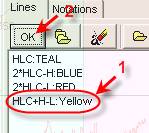
Here your line is:
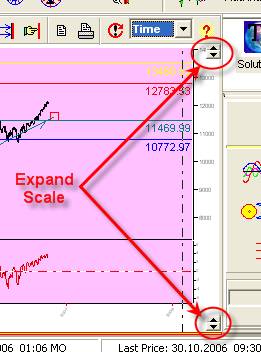
IMPORTANT NOTE:
Sometimes the lines may lie beyond the analyzed price scale so they are invisible. Using these two buttons, you can expand the price scale:
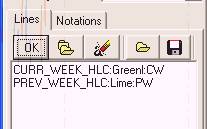
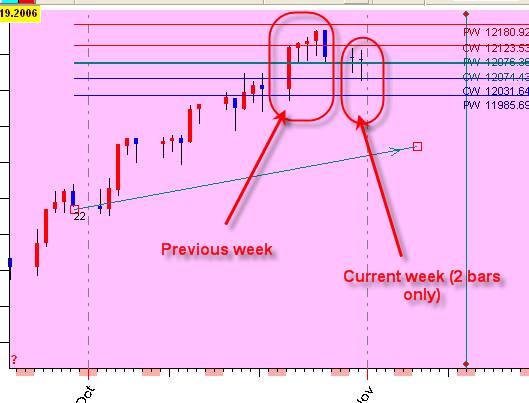
Another example. Suppose you may want to create two pivot points: one of them is based on the price history for the current week and the other is based on the data for the previous week. In this case, you need to use the special notation for the pivot point (HLC). Remember this:
CURR_WEEK_HLC stands for the current week (which is not finished yet);
PREV_WEEK_HLC stands for the previous week (i.e., the week before this one).
In this case, you will see this record:
�
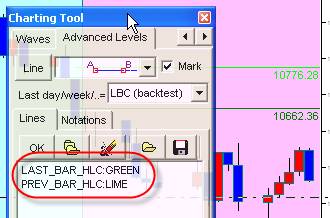
Or you may would like to calculate the pivot points for the last and previous price bars:
One more example. You might would like to see a special point (let us call it �the equilibrium point�) which is calculated as the geometric mean for two pivot points: for this month and for the previous month (the geometric mean is the square root of the product of two values).
Use this formula:
Sqrt(CURR_MONTH_HLC*PREV_MONTH_HLC):Teal
Similarly, you can record different types of support/resistance line. To make your life easier, we have created the standard library where you can choose pre-recorded lines. To add any of these lines to your list, click on this button:
You will get this list:
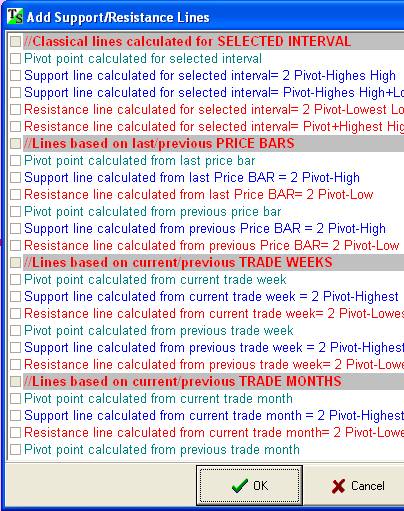
Check the lines that you would prefer to use.
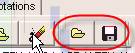
Also, these two buttons are helpful if you need to save/download your set of lines:
Visual Backtesting
To calculate any line is not a big deal. The most important question is how to be sure that these lines are worth your attention. In other words, we need to see that the lines calculated by the chosen method served actually as support/resistance. This is why we do visual backtesting.
Let me show how to do this with Timing Solution.
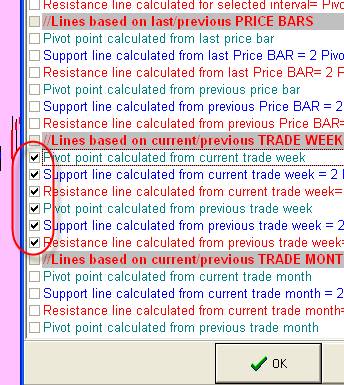
Suppose you have decided to calculate the support/resistance lines based on the price history of the current and previous trading weeks. In total, you have chosen 6 lines: two pivots, two supports and two resistance lines:
�
The program collects all price bars for the current week and the previous week; then it calculates the lines using these data:
 �
�
As you see, there is just two price bars available for this week, so the program calculates three lines for these two price bars. The previous week contains five price bars, and we use them to calculate another set of three lines (three lines for each week).
The problem is that these lines are tied with the last available price bar. It means that when new price points will come, the actual positions of support/resistance lines will change. Thus, for backtest purpose, we need to stop the data stream at some moment.
To do backtesting set this option:
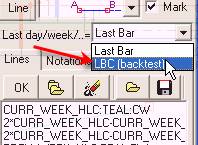
Under this setting, the current/previous week will be tied with LBC (learning border cursor) position:
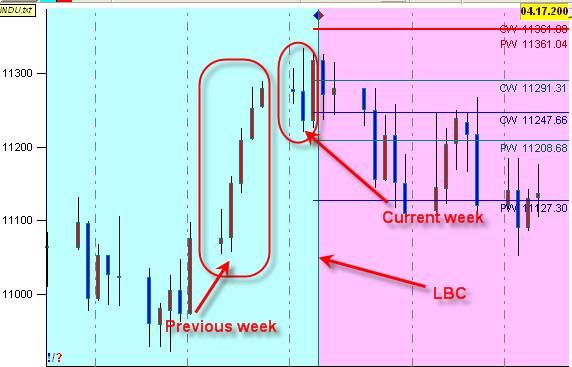
It takes as the current week the week that ends at LBC position, not the week ending at the last available price bar. THIS IS VERY IMPORTANT.
In visual backtesting, we move the LBC position and watch how these lines change. Here I use these notations:
So the recommended strategy of testing is:
1) Set the LBC at the beginning of the interval we want to backtest
(use this 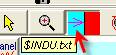 �button).
2) Then shift LBC position one price bar ahead. I recommend using this
button:
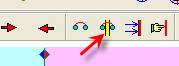 .
.
It simultaneously shifts the viewed interval.�
Also use shortcut Ctrl-L key.
Notations
H - Highest high for covered interval
L - Lowest low for covered interval
O - Open for covered interval
C - Close for covered interval
HLC - (High+Low+Close)/3� pivot point for covered interval
AH - Average High
AL - Average Low
AO - Average Open
AC - Average Close
LAST_BAR_H - High the for last price bar
PREV_BAR_H - High for the previous price bar
CURR_DAY_H - Highest high for the current day (use for intraday data)
PREV_DAY_H - Highest high for the previous day (use for intraday data)
CURR_WEEK_H - Highest high for the current week
PREV_WEEK_H - Highest high for the previous week
CURR_MONTH_H - Highest high for the current month
PREV_MONTH_H - Highest high for the previous month
Similar notation is used for Low(L), Open(O), Close(C), HLC