Charting Tools in Timing Solution
In Timing Solution you can use the standard charting tools like trend lines, Fibonacci retracement grids, Fibonacci ellipses, Gann angles, Andrews Pitchfork (with different variations) and many others. All these tools are totally adjustable: you can use a color palette while drawing different elements, customize retracements in Fibonacci module and angles in Gann Fans module, and do many other things.� The drawing panel for these tools is located in the right part of the Main Window:

It is easy to work with any of these tools. Suppose you would like to create the Fibonacci grid. Follow these steps:
a)
Click on this button: ![]() .
.
b) Drag the mouse from the starting point to the desired point:
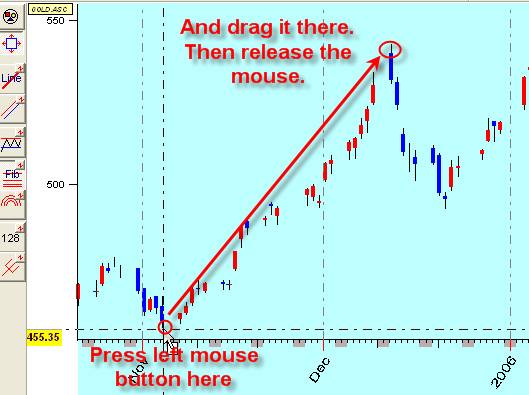
c)
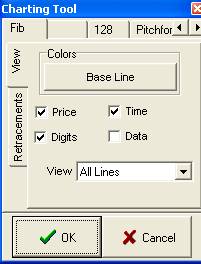
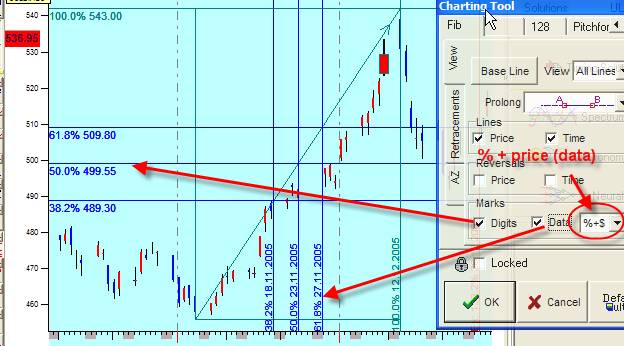
You will get the dialog box to set the parameters of this grid
(colors, retracements, price/time lines):
The retracements are available in �Retracements� tab:
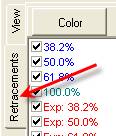
Here you can enable/disable retracement lines and set the colors for these
lines.
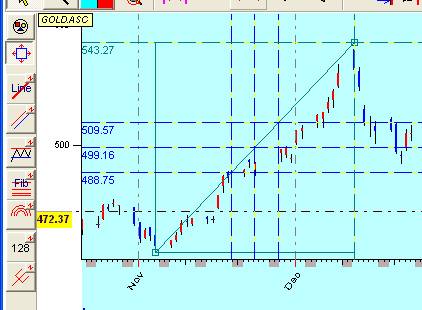
d)
Now the Fibonacci grid is ready to work with:
e) The main idea of this window is an ability to set all necessary options for Fibonacci grid. As an example, for each retracement line you can point % only, or price (or data for time retracement lines), or both. All these options are available here:
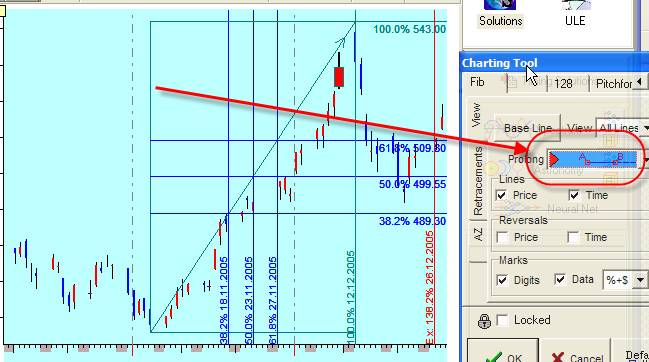
The �prolong� option allows prolonging these lines in different ways. Try to change this option, and you will see how the Fibonacci grid will change:
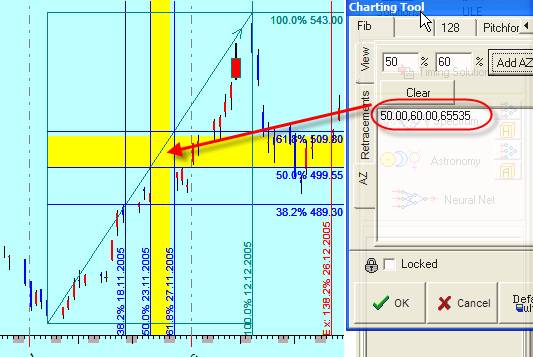
The tab �AZ� (active zones) allows to mark not just lines but the whole zones. Like here the zones 50%-60% are marked by yellows stripes:
If you want to use these option �as default�, i.e. when you next time will
work with the Fibonacci grid and use the same options, click this button: 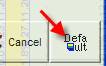
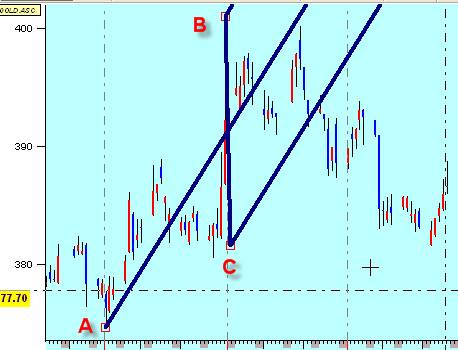
If you draw the charting figure that consists of 3 anchor points (techniques like pitchfork, channel, 128 technique), you need to perform 3 mouse clicks. For example, choose the pitchfork figure and draw it by clicking on points A, B and C:
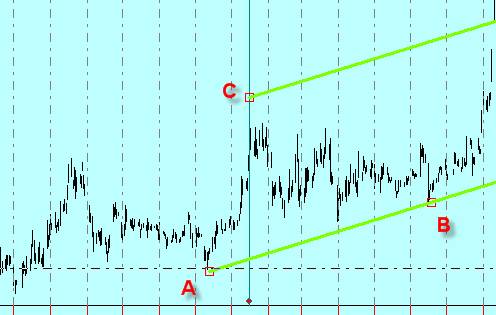
Channel:
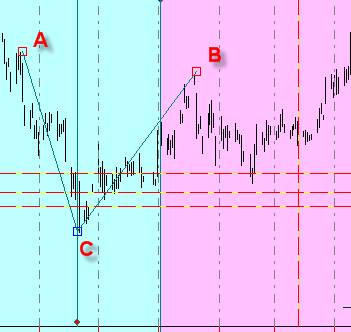
and 128 technique:
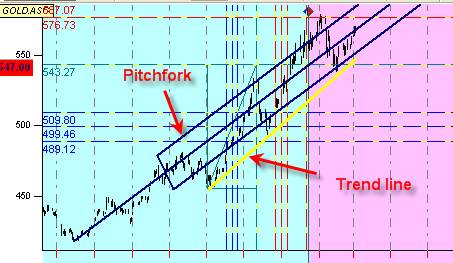
You can draw as many charting elements as you need at the same time (trend lines, channels, Fibonacci ellipses, support/resistance lines, pitchfork, etc.):
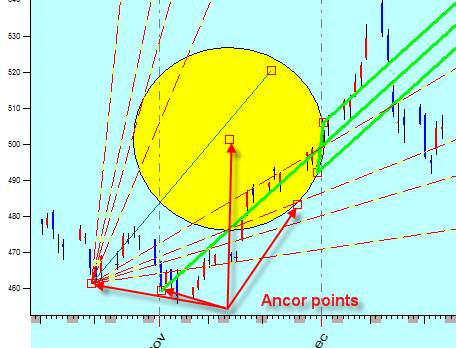
Some charting figures are pretty complicated. For example, clicking �Wave� button choose the �4 wings wave�. Here you need to set five anchor points (they are shown in the picture below). The program will draw the wave based on chosen anchor points and then prolong it into the future (and to the past).
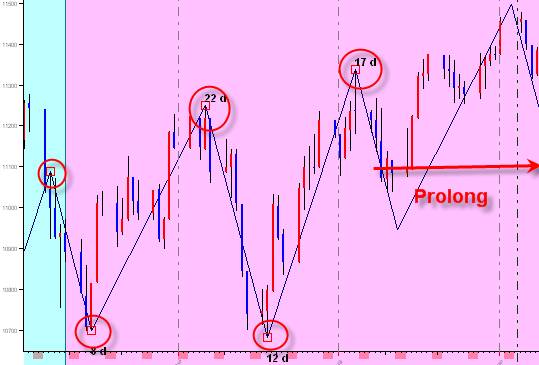
Thus you can provide the wave analysis.
Also, there is one very interesting feature in this module: you can drag any anchor point and move it watching how this wave pattern fits the real price chart.
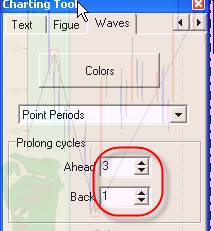
You may define how far should this wave be prolonged to the past/future. Do it here:
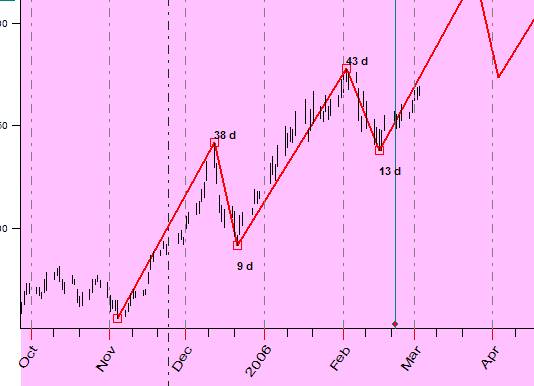
Thus, while choosing different waves your charting may look like this:
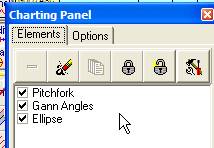
Clicking  �button, you will get the list of created
charting elements:
�button, you will get the list of created
charting elements:
You can delete any of these elements or re-define their properties (![]() button).
button).
Also, all operations with charting elements can be performed in the Main window.
These are standard operations:
1) Modification of a charting element:
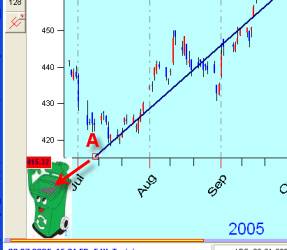
Suppose you want to modify the pitchfork chart moving the A point to the bottom:
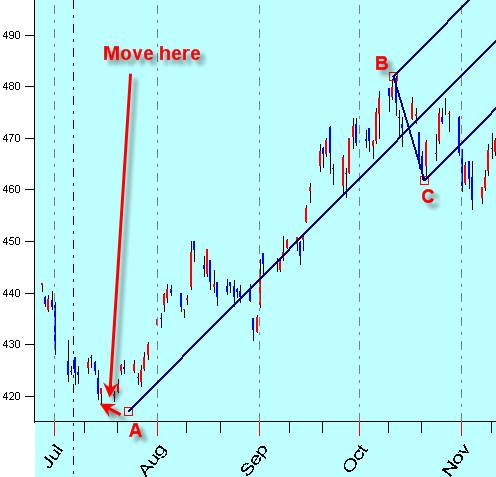
It is very easy to do. Just move the mouse cursor to A point, press left mouse button, then drag the mouse� (keeping the left mouse button pressed) to the desired position and release the mouse.
2) Moving a charting
element:
In the example above, we moved one point
A only. However, it might be necessary sometimes to move the whole
figure, i.e. moving all points A, B and C.��
In order to do that, do the same as above while moving the point A, keeping the
Shift button on your keyboard pushed. Thus you can move the whole figure.
3)
Setting options for a charting
element:
Move the cursor to A point and
click Right mouse button.
4)
Erasing the charting element:
Simply drag the cursor from point A to
this icon (it is a garbage bin):
IMPORTANT: while editing the charting elements, this button must be
pushed:
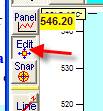
When this button is pushed, all anchor points are displayed:
�Clicking around of any of these anchor points, you can edit/move/modify any charting figure. If you do not need these anchor points, release the �Edit� button. You will get this for the example above:
There are no anchor points here.
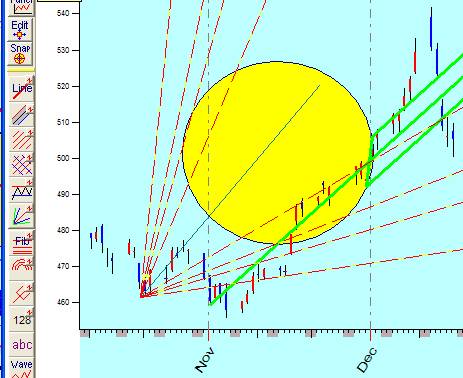
Another useful option is �Snap�:
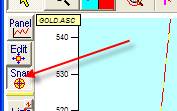
When this button is pushed, the program is trying to catch the nearest high/low point. You do not have to do anything: just move the mouse cursor to the desired area, and the program will look itself for the nearest top/bottom.
In �Charting Panel� window, under �Options�, you can define the �snap� radius:
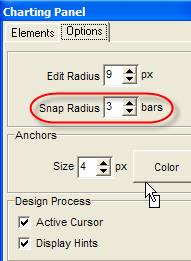
This is the amount of nearest bars used to identify high/low.�
Also, there are other useful options:
- Size and color for anchor
- Active cursor � during the drawing process, you move the mouse cursor, while the current price bar is highlighted. You can disable this feature.
- Display hints � they are shown in the bottom of the screen. You can disable this feature as well.