Upgrade August 29, 2005
Timing Solution Styles!!!
Timing Solution Styles Description
How to Make a Forecast Applying Styles
Timing Solution Styles Description
The biggest problem in doing the forecast is dealing with "meaningless infinity". It is the situation when we have too many parameters to vary and cannot make decision what parameters are really important and what are not. In this upgrade, we introduce the new feature in "Timing Solutions" module; we call it "Style". Regarding to its name, there we define the style of our forecast. The style represents the minimum set of parameters that are necessary to calculate and create the projection line. The biggest advantage of this module is "minimum set of parameters". Actually, there are much more parameters in the program. Users who prefer to play with these parameters have an ability to do it, too. They will decide themselves as well what parameter is important and what is not. It is allowed in the program, only remember about "meaningless infinity". A huge variety is not the advantage for the software oriented to real traders.
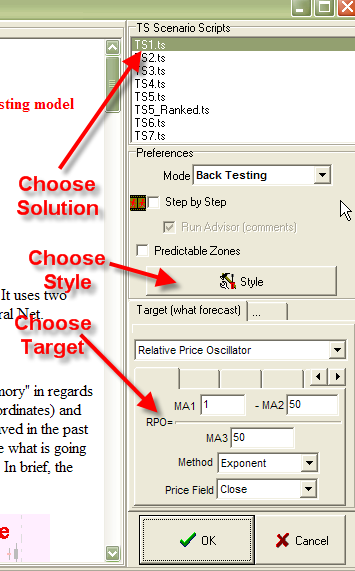
Now let us see how this technology works in Timing Solution software. When you click on "Timing Solutions" button, you will get this window:
Choose here the Timing Solutions file (*.ts), define what you would like to forecast (Target) and then go to the new feature of Timing Solutions - Style.
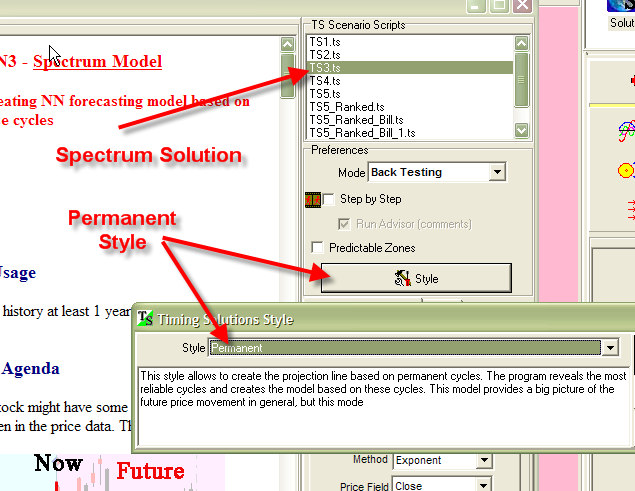
Clicking on this button, you will get:
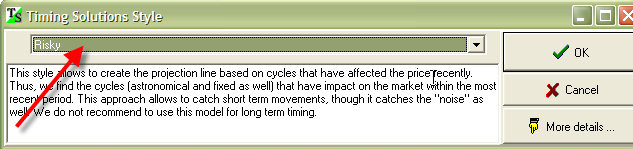
You can choose one of the Styles from this menu. As it is the experimental method, we use it now for astronomy based and spectral models only. Styles make a difference for these types of models. Let choose one of them, "Risky". Its description is in the window.
To see what these styles really do, click on "More details" button:
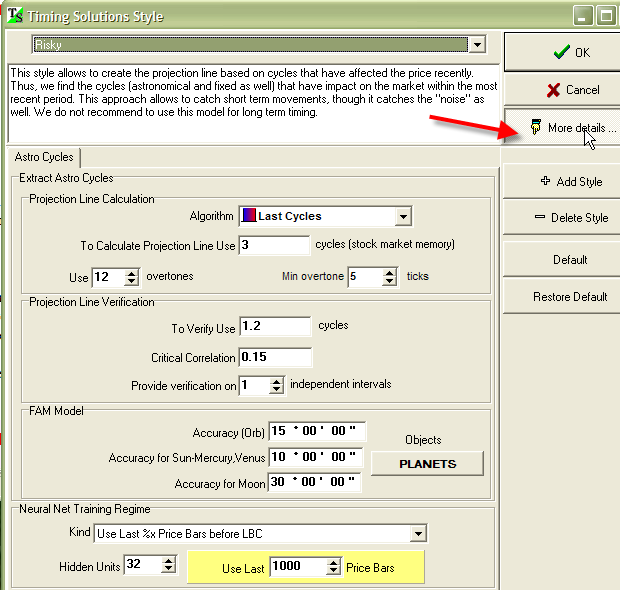
You get the set of parameters that are necessary to get the forecast (the set for astro cycles is shown).
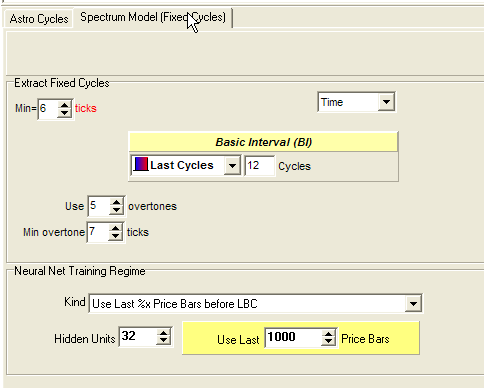
For Spectrum based models, you will get another set of parameters:
In previous versions, you could do the same using "step-by-step" mode. You still can work in this mode ("step-by-step"). And you can add to it three new pre-tested styles that are available in this upgrade.
Here they are:
This set of buttons:
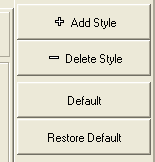
allows to manipulate with the styles. You can save, delete any style or save it as a default style.
Different styles provide different projected lines. Look at these projection lines calculated in different styles for light crude oil price:

A simple spectrum model has been applied. The red curve describes weekly price movements better, as it is concentrated mostly on latest cyclic processes in price (it is possible due to our multiframe technology), while the blue curve that represents a moderate style model is more suitable to forecast monthly movements.
As I said, this is one more experimental technique, and I need to check it more. Preliminary results show that the permanent style model works better for astronomy based models.
Please be advised to NOT create the style files with the names ts1.tso, ts2.tso ... ts100.tso. These names are reserved for other pre-tested styles that will be distributed with future upgrades. We are still looking for the best combinations of parameters for moderate, risky and permanent styles. Use some other names.
How to Make a Forecast Applying Styles
Timing Solutions module has a tremendous forecasting potential in it. Combining different solutions and styles, you can provide the forecast for different financial instruments. The table below is a sample of the information that I use to produce such a forecast. It contains the results of back-tested models combined with different styles. The red cells show the best combination of the model and the style:
| Target:
Relative pr. osc (1,25,25) |
Dow Jones Industrial | S&P 500 | NASDAQ | Gold | EURO/USD | Crude Oil |
| Astro model: TS1.ts
Style: Permanent |
Sometimes indicates turning points (TP) | Describes 10% of trend changes and indicates turning points | Describes 15%-20% of trend changes, very good combination! | Noisy | Noisy | No trend forecast, though TP are indicated |
| Spectrum model: TS3.ts
Style: Permanent |
Trend forecast for a month | Describes 4%-7% of trend changes | 14%-17% of trend changes | Noisy | Noisy | Noisy |
| Astro model: TS1.ts
Style: Moderate |
Noisy | Noisy | Describes long (6 month) waves 20% | Noisy | Noisy | Good for trend forecast during 6 months, but sometimes may fall into unpredictable mode |
| Spectrum model: TS3.ts
Style: Moderate |
Very good for trend forecast - few months ahead | Noisy | Describes 10%-12% of trend changes | Very good; describes 24% of trend changes | Noisy | Trend forecast during 6 months, but sometimes may fall into unpredictable mode |
| Astro model: TS1.ts
Style: Risky |
Noisy | Noisy | Noisy | Noisy, though short term forecast is possible | Empty | Noisy, may be short term forecast |
| Spectrum model: TS3.ts
Style: Risky |
Very good for short term forecast | Describes 15% of trend changes | Noisy | 6% trend | 1 month forecast | Noisy |
It is very easy to work with this table. Let us say that you would like to make a trend forecast for NASDAQ index. You can apply either astro-model or Spectrum model. For each model, you may use one of three styles. It gives you a choice from 2X3=6 combinations. All these combinations are shown in the table above.
You may choose one of them. Let it be this one:
| Spectrum model: TS3.ts
Style: Permanent |
Follow these steps:
Here you select the solution and the style. Then the program produces all necessary operations automatically and displays a forecast.
The table above is a result of a huge job, and this job is not done yet. More research and testing will give us a new information, so there will be new additions to this table as well as some corrections. Your opinion and experience will be very helpful.
Sergey Tarassov
August 28-29 2005
Toronto, Canada