Upgrade June 18, 2007
Upcoming Events Module
This module gives you hints regarding future price movements. It is very easy to do.
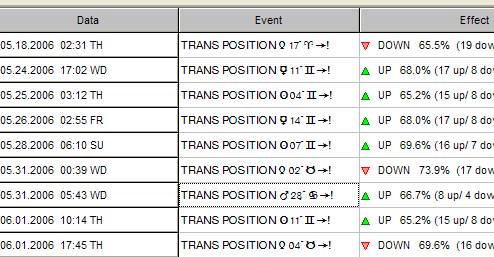
As a result, you will get the table like the one below. There you can see the data/time type of event and the effect of this event on the chosen market. These hints are obtained by statistical analysis of previous price movements:
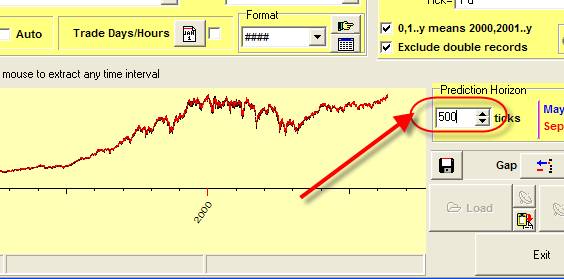
Let�s try to get this table. First of all, while downloading the price history, set the length of your �forecast horizon�. It shows how far ahead the forecast will be performed:
Now follow this path: �Tools� -> �Upcoming Events�. That is it, your forecast is ready.
The program analyses several hundreds of astronomical/astrological phenomena in respect to ALL available price history and performs the statistical analysis for each event.
It uses for forecasting only the phenomena that are approved by statistical analysis. Thus the program picks up only few events from the list of several hundreds.
The content of this table is pretty obvious:
 �
�
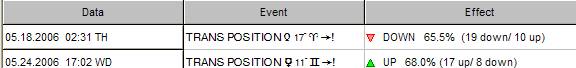
It shows the exact date for each event and its influence on the chosen market. Look at the first row on this table. It says that when Venus ingresses the 17th degree of Areas, the price of the chosen instrument usually goes down (19 times down against 10 times up).
Click the ![]() �button. The table will be saved in HTML
format, and you will be able to view it through Internet Explorer. It looks
like this:
�button. The table will be saved in HTML
format, and you will be able to view it through Internet Explorer. It looks
like this:
�
|
Data |
Event |
Effect |
|
|
05.18.2006
02:31 TH |
TRANS POSITION c 17� � �! |
DOWN 65.5% (19 down/ 10 up) |
|
|
05.24.2006
17:02 WD |
TRANS POSITION a 11� � �! |
UP 68.0% (17 up/ 8 down) |
|
|
05.25.2006
03:12 TH |
TRANS POSITION [ 04� � �! |
UP 65.2% (15 up/ 8 down) |
|
|
05.26.2006
02:55 FR |
TRANS POSITION a 14� � �! |
UP 68.0% (17 up/ 8 down) |
|
|
05.28.2006
06:10 SU |
TRANS POSITION [ 07� � �! |
UP 69.6% (16 up/ 7 down) |
|
|
05.31.2006
00:39 WD |
TRANS POSITION c 02� � �! |
DOWN 73.9% (17 down/ 6 up) |
|
|
05.31.2006
05:43 WD |
TRANS POSITION g 28� � �! |
UP 66.7% (8 up/ 4 down) |
|
|
06.01.2006
10:14 TH |
TRANS POSITION [ 11� � �! |
UP 65.2% (15 up/ 8 down) |
|
|
06.01.2006
17:45 TH |
TRANS POSITION c 04� � �! |
DOWN 69.6% (16 down/ 7 up) |
|
|
06.01.2006
21:35 TH |
TRANS POSITION g 29� � �! |
DOWN 66.7% (8 down/ 4 up) |
|
|
06.02.2006
11:17 FR |
TRANS POSITION [ 12� � �! |
UP 69.6% (16 up/ 7 down) |
|
One important feature of this module is the �Model� option:
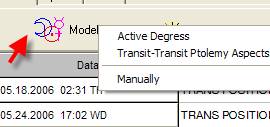
You can use three standard models. One of them analyses what happens to the market when some planets pass some Zodiac points/areas. Another model analyses transiting aspects (5 major Ptolemy aspects). Pay attention to the fact that the program includes transiting cusps automatically when you download the intraday price history data.
If you go through� �Model� tab, you will get the list of all analysed phenomena and the list of the most important ones.
The �Options� tab allows controlling the statistical algorithms. I recommend to use these options as they are:
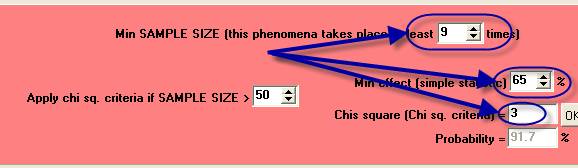
Play with them, if you are familiar with the science of statistics. I have marked the parameters that could make the algorithm more selective. In other words, if you increase these parameters, the program picks up the strongest phenomena only.
�����������