Upgrade September 27, 2007
Forecast models based on planetary speeds
In this upgrade I have found a way to work with planetary speeds smarter. Actually you were able to work with planetary speeds before, using this ULE event:
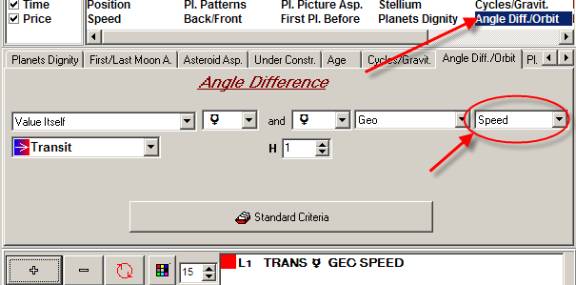
For example, this is the diagram of Mercury speed:
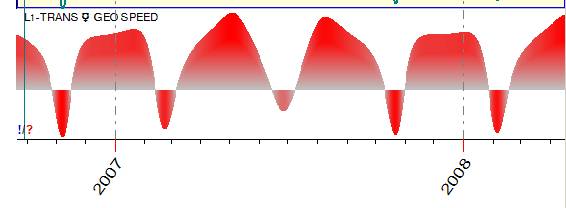
However, the usage of this type of events for the forecast
is not a good idea. It is much better to forecast with the planetary speeds if
we apply the ideas that come from Fuzzy Logic science. Instead of using the
speed itself, we deal with events like this one: "Mercury is direct and
its speed is the highest" or "Mercury is retrograde, and its speed is
medium".
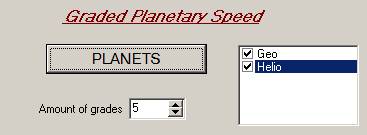
To create this kind of events in the Neural Network module, follow these steps:
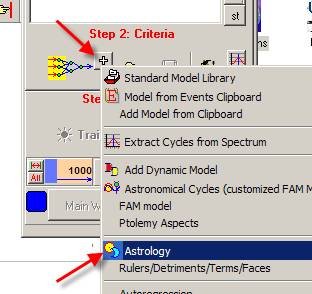
Here choose this tab:
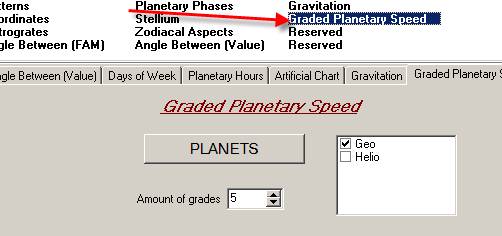
See what events the program creates for the Moon (as an example):
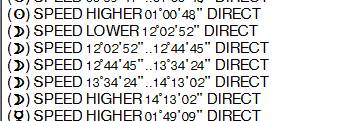
1) 20% of the time ("20" - because the amount of grades=5) the speed of the Moon is lower than 12º2�52�
2)
�Another 20% of the
time the speed of the Moon is between 12º2�52� and
12º44�45��
3) �Next speed range is 12dº44�45�� and 13º34�24��
4) 13º34�24�� and 14º13�02��
5)
�and finally 20% of
time the speed of the Moon is higher than 14º13�02��
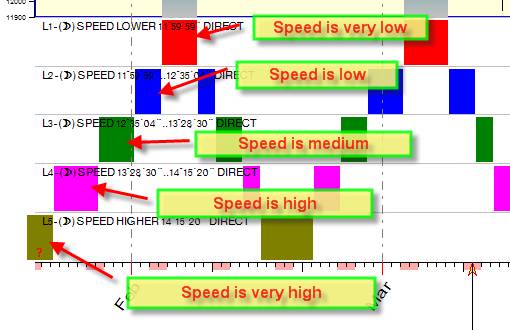
The most important issue regarding this way of breaking the Moon's speed is
that they are of equal time intervals. See how these events for graded Moon's
speed look in time:
Starting from this upgrade, you are able to apply these
events to generate the Neural
Network projection line using all planets in geo and helio Zodiacs:
These are the random projection lines based on planetary speeds:
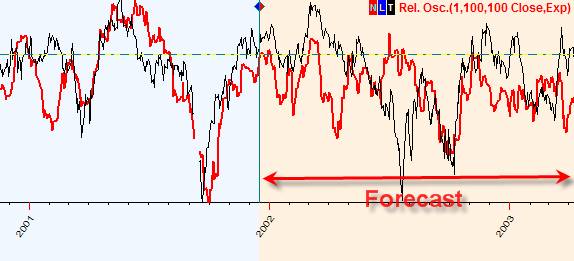
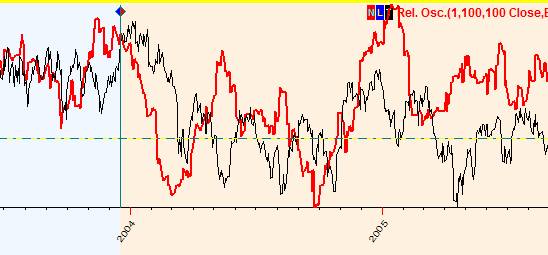
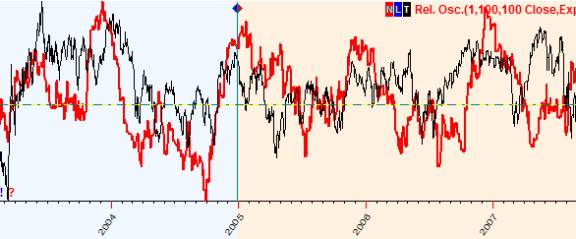
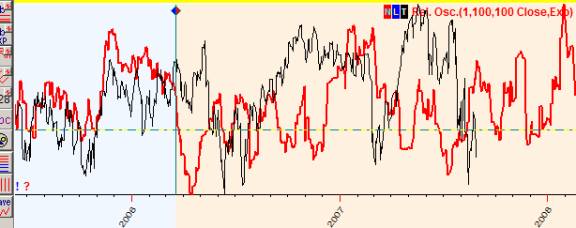
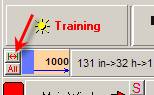
Here I use planetary speeds for the planets in Geo and Helio� Zodiacs; training interval = 1000 bars:
The detailed Back Testing for this model shows that the best training interval for the short/medium term forecast is 500 bars (2 years). Here is the statistics that shows how these models forecast future %X bars ahead:
|
Forecast %X bars ahead |
% positive correlations between price and projection line |
Average correlation |
|
10 bars |
62.5% (+125/-75) |
0.153 |
|
20 bars |
60.0% (+120/-80) |
0.145 |
|
30 bars |
60.5% (+121/-79) |
0.124 |
Also this model is good to forecast 1 year ahead (250 bars). To make a long term forecast, set the training interval to 2.000 bars (8 years). This is the statistical result for this model:
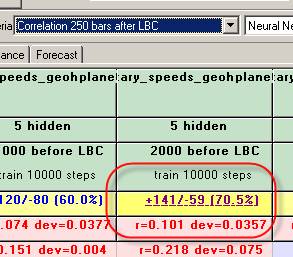
The Back Testing report is here (800Kb)