Non future leaks technology
Items covered in this section:
Future Leaks Problem
You may be familiar with the following situation: you have bought some software/trading course/book and realize that their methods "do not work for you". The reason for all this disappointment is not because "it does not work for you". The reason is much simpler: your decision to buy was based on just one or two (or even several) "good" examples. In reality it turns out that majority of examples that you see are not so "good" or are totally "bad". Such a situation occurs because there are thousands of ways to make any theory look good. Only "the cold wind of reality" can show the true usefulness of any idea. It would be better for you to realize this before you start trading using a particular technique and risk your own money. The problem is that vendors of these ideas/techniques/theories are often victims by themselves; they might be doing that unwillingly. Why? There are so many reasons for that - from a poor knowledge of research methodology and statistics to the absence of comprehensive theory of what is actually happening on the markets and what moves the stock prices.
One of the most common reasons may be the use of future leak technology (or the use of the information received later to backing up the events that took place earlier). Sometimes future leaks are very tricky, and it is not easy to detect them.
This is an example of what a future leak is. Lets assume you are testing a particular model to see how it predicts stock movements. You want to train your model on stock prices from 2010 to 2015 and test how well the model fits the price data from 2015 to 2018. Future leak occurs when the program uses data up to 2015 as intended and then uses more data after 2015 to adjust the results and make it fit better with the data after 2015.Instead of using only the price data ending in 2015 and making a forecast from 2015 to 2018, the program actually "looked" into the future, and as a result trained your model on the data that ends in 2018. Such model may look really good. It is no surprise as it is trained on real data. Will it be able to make the same good forecast? It is uncertain. All it says is that the program works well in describing the PAST. It is similar to the situation when a student has some problem to solve. Instead of doing the homework, that student opens the answer at the end of the lesson and copies it. Will that student be able to solve a similar problem? It is uncertain.
Timing Solution software is aware of that. Non future leaks technology incorporated in Timing Solution allows you to see the actual performance of the models. The idea came from Neural Network's Back Testing technology. With it, we have blocked hundreds of situations when models that actually have poor performance could make a "good" impression.
How do we do that?
In Timing Solution all downloaded price history is divided in two intervals: a training interval (usually blue) and a testing interval (usually red or pink; in this lesson it is shown creamy - to remind you that you are able to choose colors that you like):
There is only one reason behind it: avoiding any kind of future leaks.
To train the models, we work with the data from the training interval. The testing interval serves only for checking the forecast. We do not use the data from the testing interval to "cook" or adjust our models.
Learning Border Cursor (LBC)
The border between the training and testing interval is called Learning Border Cursor:
This border can be moved to any side. But - no matter where it is, only the data to the left of it is used to train our models while the data to the right is used to test the forecasting ability of the model, and only for that.
When we create a model, the program does not know about the price movements beyond the LBC. So if we get a good projection line after LBC, this is a true sign that our model is able to generate a good projection line.
This means that you always need to leave some price history data beyond LBC to verify how your model works. In statistics this interval is called "out of sample".
You can set LBC manually; just move the mouse to any place on the price chart (it will be a position of your LBC) and click the right mouse button.
Choose this item, and program will set the LBC on the chosen position.
The same result can be achieved if you press this button:
and click the mouse at the position where you need to set the LBC.
If you work with Neural Net module, you can do this procedure multiple times while the Neural Network is training. Thus you can observe how the projection line is changing when the new price bars are added. If you have decided that the model is good enough (we will discuss later what this means), you can set the LBC on the last price bar:
Now the program will use all available price history to generate the projection line. We call this situation as "Final Forecast".
Once again: you look for a "good" model by training it on a training interval and testing its forecast ability on a testing interval. Timing Solution software does not allow to use any portion of data from the testing interval to train the model; it is the only way to avoid future leaks. When a "good" model is found, you may use all available data to create a projection line based on that model.
Avoiding future leaks is extremely important as there are so many cases when a model shows a very high correlation on a training interval and practically does not work at all on a testing interval. A high correlation on a training interval says only one thing: that the software used by you is able to create a model that reconstructs past market moves well enough. It is just a first step, though. Some new information can change that wonderful picture in a second. Our life would be much easier and we would be able to make a true forecast/projection of what will happen if we would know what moves the markets and how it actually works. We do not have this knowledge yet, so we can only speak about probabilities. That is why we need to exclude all factors that can distort our forecast. And future leaks are among those factors.
Testing Interval (after LBC)
In the program the training interval is marked as "before LBC", and the testing interval is marked as "after LBC":
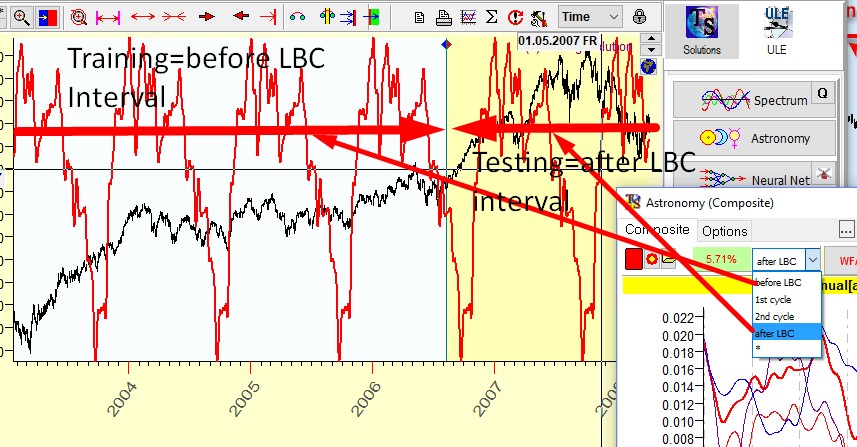
You can calculate a correlation between the price and the projection line on any interval. If that is done on Training interval (before LBC), it shows only how good the model is in explaining the past (the higher the better). However, it does not tell how well this model will predict the future. The forecasting ability can be calculated only when future leaks are avoided; it is a correlation on the interval after LBC.
Simplest backtesting
LBC is useful to do a quick backtesting of any model created by Timing Solution software modules. It is simple to do by varying LBC position. Below are some examples for S&P500 that show how to do that.
Let set LBC to the beginning of the year 2010. Now we want to see how different modules work.
Spectrum module: We run Spectrum module; the program calculated price spectrum using the data only before 2010. There we have found the 753-days cycle and created a projection line based on this cycle. Now let us watch how it forecasts future price movements:
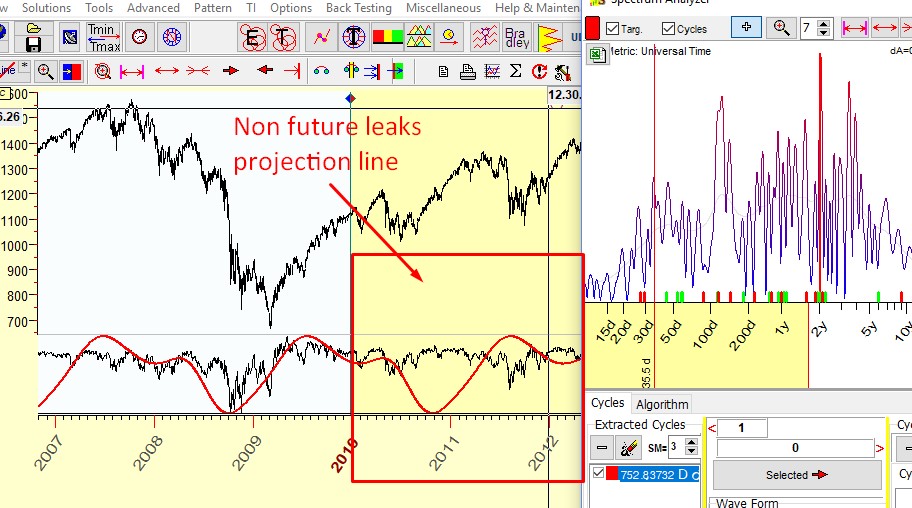
The projection line starts in 2010. This is non future leaks projection line; it is based on 753-days cycle that we have found for the data before 2010; the price data since 2010 is used to compare the forecast with actual price movements. It is important to remember: the model used for the projection line "does not know" about future price movements; it does not matter when we do this testing - in 2011, 2015, 2018. The data after LBC serve only for visual evaluation of goodness of our projection line.
Composite module: The procedure is the same. We run Composite module; as an example let us set there Venus synodic cycle (which is the angle separation Venus - Earth in helio). And we watch how the projection line from this Venus synodic cycle works after LBC:
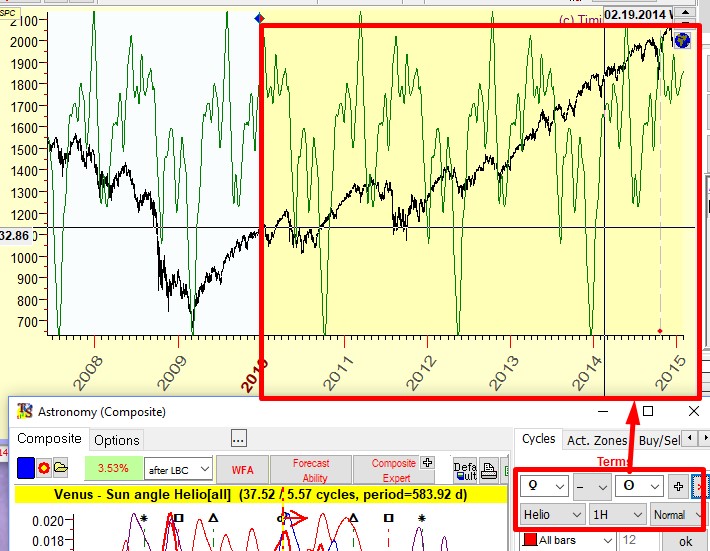
Pay attention to another important thing: the part of the line before LBC always looks better than the projection after LBC. This is Ok. If the model shows the line which does not reflect well the price before LBC, it is not a good model to work with. Either try another one or change the data interval before LBC.
Natural cycles module: As an example, let us consider one of the Annual cycle variation that we can create with this module. Let it be Annual decennial cycle (Annual cycle based on the data for every 10th year going back from a certain chosen year), and let the starting year for the analysis be 2010. Here you should set this module to backtesting mode and set XXX0 decimal pattern, so the program calculates the projection line using the price history before the year 2010, and not the whole price history, but only portions of it including the years 2000,1990, 1980, etc.:
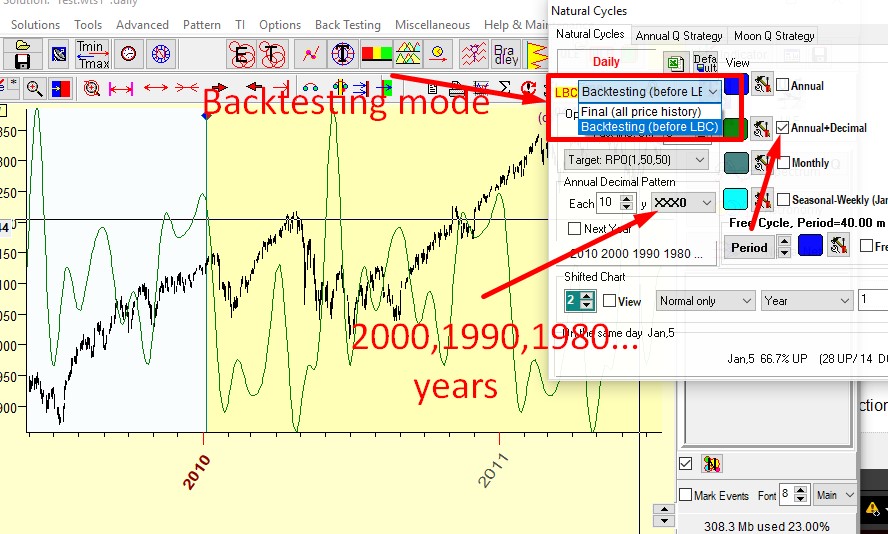
As in examples above, the data after LBC (after 2010) serve to evaluate how this model is able to forecast future price movements.
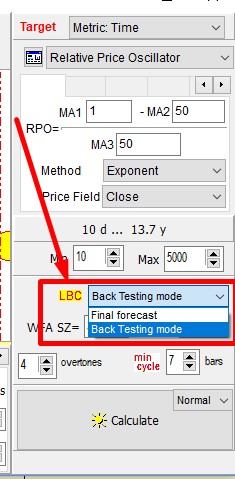
Q-Spectrum: If you prefer working with Q-Spectrum module, "back testing mode" should be activated as well:
NOTE. The projection lines based on different models that you can create using any module of Timing Solution do differ though the position of LBC is one and the same. We have shown these samples as a motivation to explore the opportunities provided by the software.
This covers the Learning Border Cursor section. Next lessons will discuss in detail how to use the most popular methods to create a projection line in Timing Solution.