Working with Market Data
Items covered in this section

Timing Solution Main Window
When you work with Timing Solution software, all important things are happening in the Main Window. This is how it usually looks, together with labels that show groups of buttons related to one theme:
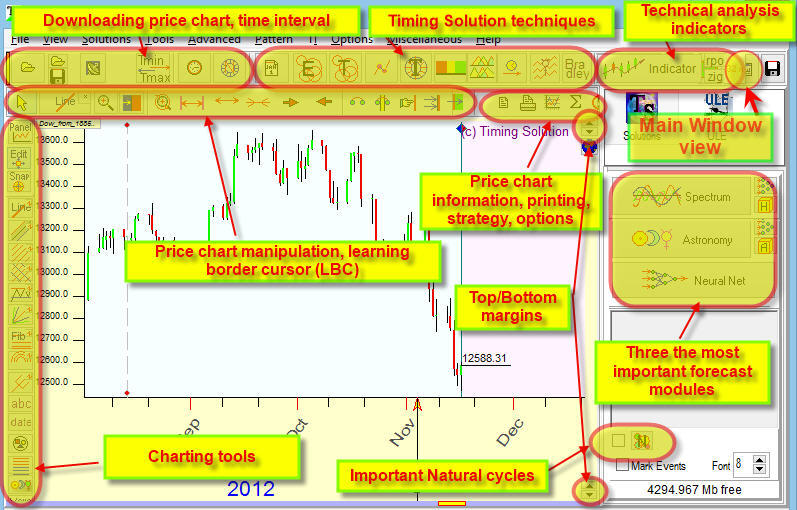
Click on any button to open a separate window dedicated to some specific task. You may want to use Timing Solution techniques (the middle of the top panel) and Timing Solution forecast modules (they are on the right panel). You may try some charting tool (these are shown on the left panel), and for each one you may choose parameters that you like. Or you may try some Technical Analysis indicators (they are in the top right corner), with your choice of details.
However, when you open the software, the main field is empty, and majority of buttons is not available.
To activate program's features, you need to start with downloading some data and making necessary calculations.
Getting the data
Before making any forecast, you need to do some steps first. You need to decide what financial instrument you plan to work with. And then you need to find the data for that financial instrument. You may have your own data source. Or you can work with the data sources suggested by Timing Solution team. Please see below what is there for you.
What data the software is able to work with?
- Firstly, we have our own data feed system (Timing Solution Datafeed). It provides EOD data for 100K+ financial instruments: stocks and indexes (including international ones), futures, Forex, crypto. It is free for Timing Solution users.
- Second, you may work with your own data source. Timing Solution software is able to read price history data presented as some Excel/Text file. Now (October 2025), the program reads more than 2K+ different data formats. In other words, if you used to work with some other data source/service/software (like Trading View) and can save your data into Excel/Text file, practically in all cases you should be able to download this price history file into the software and work with these data, applying all features of Timing Solution software.
- Being supporters of the idea that the data for research should be open to all,
we keep an eye on free price history sources. For that, Timing
Solution software has a possibility to download price history data from
Yahoo, FRED, Alpha Vantage services. The program also easily reads price
history data provided for free by some Internet data sources such as investing.com, stooq.com, etc. - directly from their websites (see this
list http://www.timingsolution.com/TS/Links/price_data.htm ).
- FOREX traders can use MetaTrader data
feed; it is free mostly (depending on your broker).
- If you are subscribed to e-Signal streaming service, you can download
their price history data and
stream real time data into Timing Solution.
What data is preferable - intraday, EOD, daily, weekly, monthly, etc. and what is a tradable forecast horizon
Timing Solution works with any price bar: 1, 5, 10, 30 seconds, 1, 2, 3, 5, 10, 15 minutes, 1, 2 hours, EOD, weekly, monthly, quarterly and yearly charts.
Let's start
The short video regarding getting price data is here: https://www.youtube.com/watch?v=0ftzbSiZFIs&t=238s
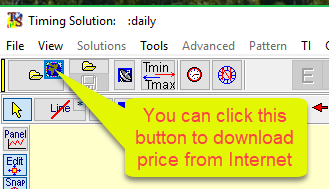
Firstly, to download price history, click one of these buttons:

This is the very first step; other steps are shown below. They are slightly different, depending on the source of your data.
Downloading data from a file
You may have data saved previously on your computer as a text file. If it is the case, follow these steps:
Choose a proper folder and highlight the file you plan to download (steps 1 and 2):
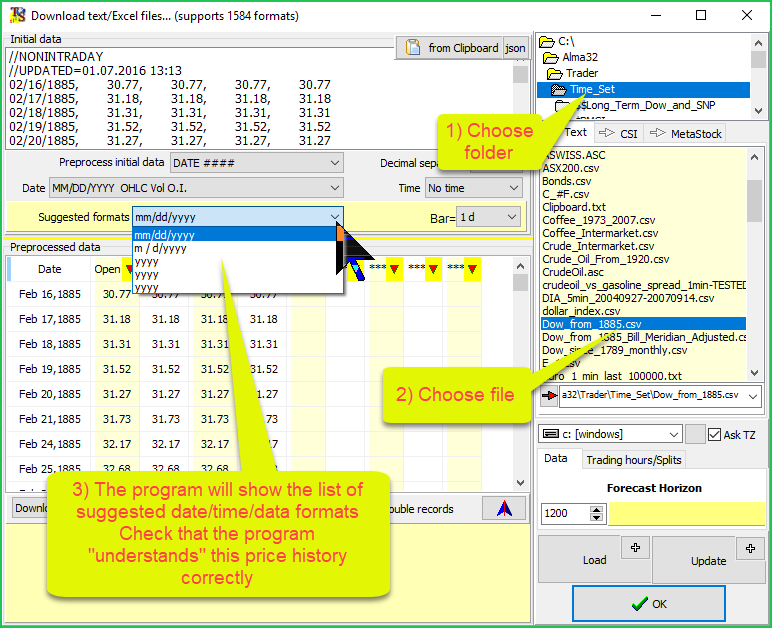
The program shows the list of suggested data formats. In most cases the program automatically finds a proper data format for a chosen file. Make sure that the format of your data is in this list (step 3). If you do not find it here, please contact TS Support team at timingsolution17@gmail.com or support@timingsolution.com .
Other steps are easy. Click "Load" button to preview the price history (step 4):
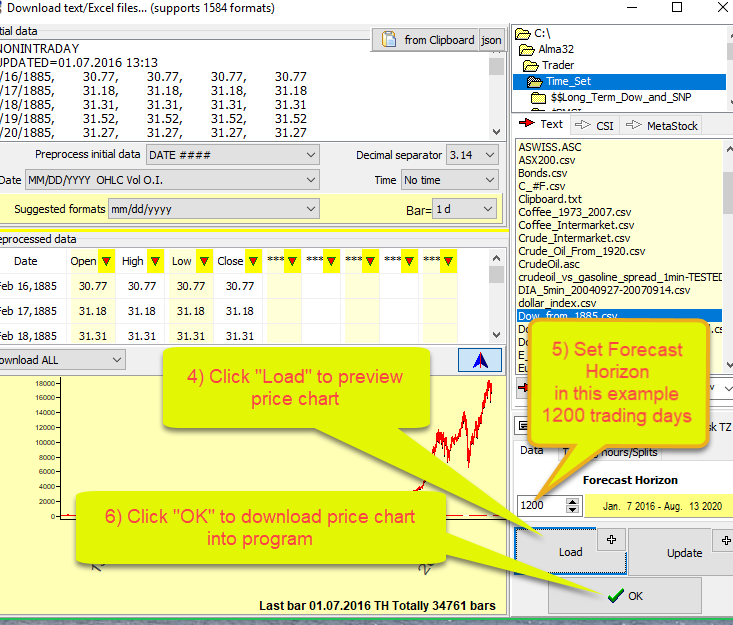
Do not forget to set a forecast horizon (step 5; see below). Then click OK button (step 6), to download the price chart into Timing Solution.
Forecast Horizon
Forecast Horizon is a very important parameter. Here you define the length of the forecast you are going to make applying various modules of Timing Solution software. It is a parameter set for all models you may use later. In the example it is 1200 trading days. That means that you will do the forecast for 1200 trading days ahead.
Downloading data from clipboard
You may want to work only with a portion of your saved txt or Excel price history file. It is easy to do. Copy that portion to the clipboard and then do this:
Steps are the same as in the previous example (downloading data from file):
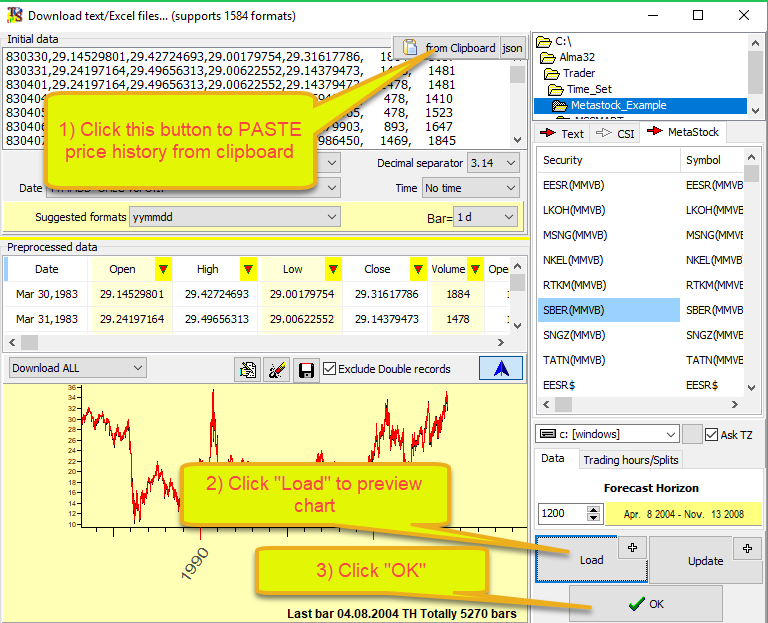
- click "from Clipboard" button to paste the piece of price history from clipboard (it is step 1 on the picture above),
- check date/time/data formats,
- click "Load" (or "Update" if you need to update the price history) button to preview the chart (step 2),
- click "OK" to download this chart into Timing Solution (step 3).
It is a useful feature if you have already some data file downloaded and need to add more newly arrived data to it. (Please see the example further below.)
Downloading data from Internet
Timing Solution software allows working with the price data found online. The "globe" button from the Main Screen does that:
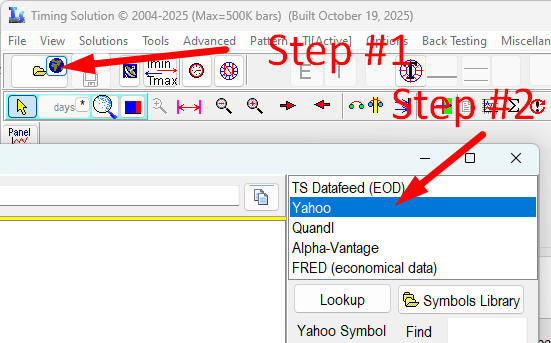
You can download the price history directly from these sources:

Timing Solution Datafeed: it is a free service for the Timing Solution customers. It provides price history for 100K+ financial instruments and allows to download EOD, weekly and monthly data.
Yahoo: Yahoo Financial service; works for EOD, weekly, monthly and also some intraday charts (5 min, 15 min, 30 min and 1 hour charts).
Quandl
Alpha-Vantage
FRED - Federal Reserve Economic data; this is a good source of economic data
Working with TS Datafeed
You need to choose the category of financial instrument (as an example, "Crypto") and find there the name of your financial instrument (Bitcoin). Then click "Download Data" button:

ATTENTION: The list is organized in a certain way. You may not see your crypto item in the opened window. In this case, you need to display the full list of cryptos (4K+ items). To do that, set ON "All Cryptos" option:

Downloading from Yahoo
To download price history data from Yahoo financial service , please follow steps shown below :
a) choose this option:
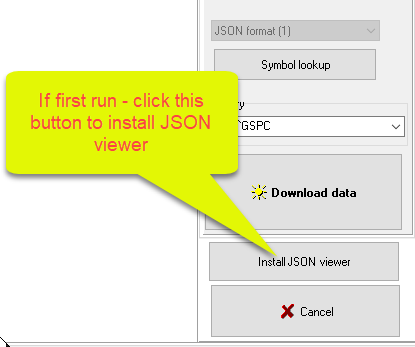
b) If this is the first time to do this procedure on your computer, start with installing JSON viewer. Click this button:
c) type Yahoo symbol of the financial instrument that you want to download and click "Download data" button:
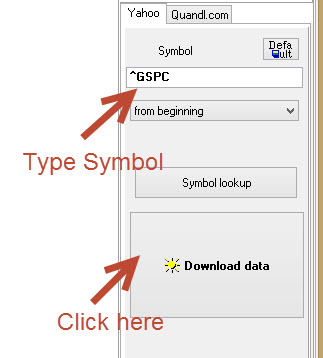
Here ^GSPC (Yahoo symbol for S&P 500 index) is used.
To get used to Yahoo symbols, try to put some other symbol instead: IBM Yahoo symbol for IBM corporation shares, or MSFT for Microsoft shares, or any other. The list of symbols used by Yahoo service is on Yahoo website.
d) if everything is OK, you get the list of prices like the one below. Click OK button to continue:
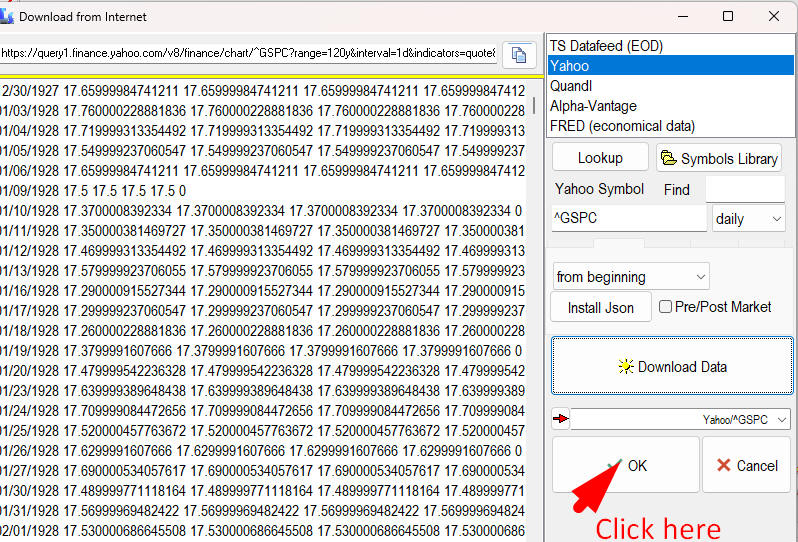
The program will ask you to enter the information about the exchange location and then will import this price chart into Timing Solution.
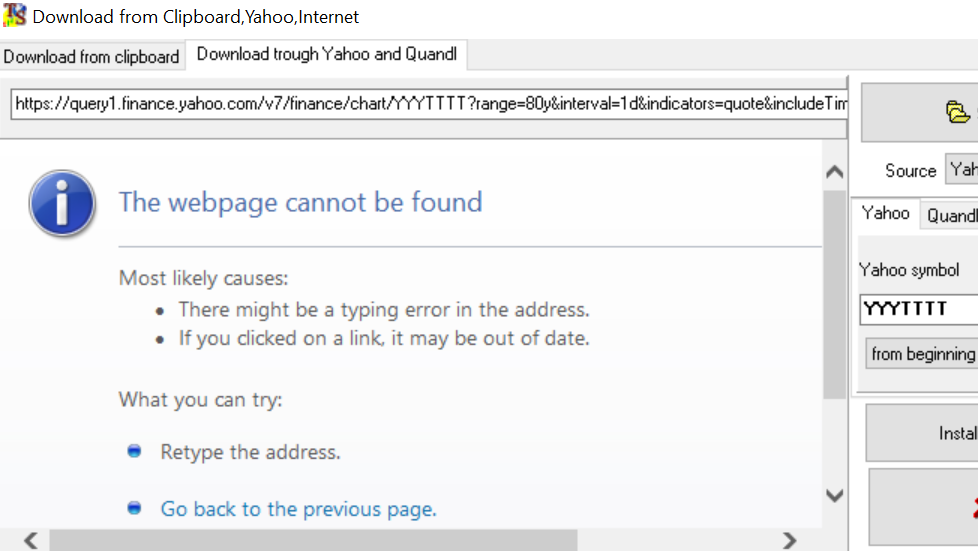
e) If you type an incorrect symbol, you will get a prompt like this:
Downloading data from Metastock files
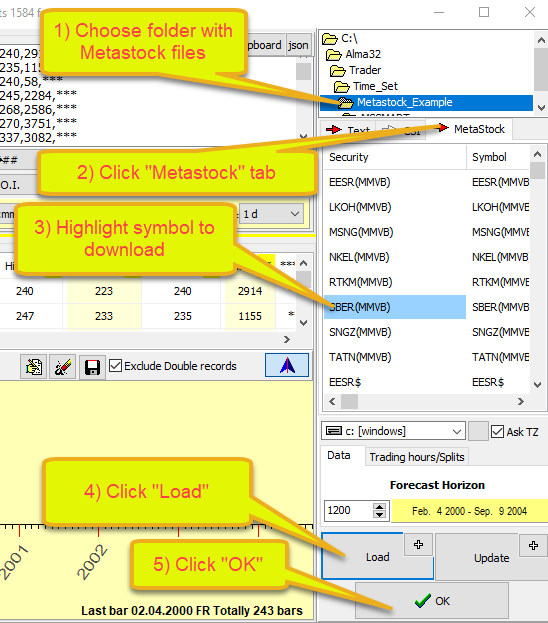
To download Metastock data, do this:
- choose the folder with Metastock files and click "Metastock" tab;
- highlight a symbol to download;
- click "Load" button to preview the chart and
- click "OK" to download this price history into Timing Solution:
Downloading data from other Internet sources
There are many other websites where you can download price history for different financial instruments. As an example, since October 2018, Timing Solution users may download the price history from websites www.investing.com or www.stooq.com (Polish website) or www.measuringworth.com/ (long term economical data, gold etc,) and many others. The list of websites that provide financial information can be found on www.timingsolution.com website in Links section. These websites are constantly changing, new websites appear.
When you work with the data from one and the same site all the time, you may want to speed up the process of downloading. Instead of downloading all availble price history every time you work with the software, you can add recently added data only. Do that it using "downloading from clipboard" feature in Timing Solution. (This feature was discussed briefly above.)
Consider this example. Suppose you work with bitcoin price provided by www.investing.com website. You have already downloaded the data since 2011 till October 2018. In a week, you want to add newly added data to your file. Here is a small piece of bitcoin data in Excel format:
| Date | Price | Open | High | Low | Vol. | Change % | |
| 5-Oct-18 | 6,600.80 | 6,584.20 | 6,644.20 | 6,537.60 | 9.18M | 0.25% | |
| 4-Oct-18 | 6,584.20 | 6,509.20 | 6,653.00 | 6,487.80 | 9.31M | 1.17% | |
| 3-Oct-18 | 6,507.80 | 6,549.90 | 6,563.50 | 6,429.60 | 9.21M | -0.64% | |
| 2-Oct-18 | 6,549.90 | 6,608.20 | 6,645.70 | 6,034.90 | 9.34M | -0.88% | |
| 1-Oct-18 | 6,608.20 | 6,635.20 | 6,674.70 | 6,072.70 | 9.19M | -0.41% | |
| 30-Sep-18 | 6,635.20 | 6,603.90 | 6,673.90 | 6,533.50 | 9.34M | 0.47% | |
| 29-Sep-18 | 6,603.90 | 6,633.90 | 6,648.40 | 6,464.40 | 9.42M | -0.48% | |
| 28-Sep-18 | 6,636.00 | 6,685.70 | 6,809.20 | 6,538.60 | 9.57M | -0.79% |
Save this info into clipboard (in Excel do this: Ctll-A to select all records and after that make right mouse click and choose "Copy" item in the pop up menu). Now go back to Timing Solution software; to download this price history to the software, click "from Clipboard" button. The data will be transferred into the program:
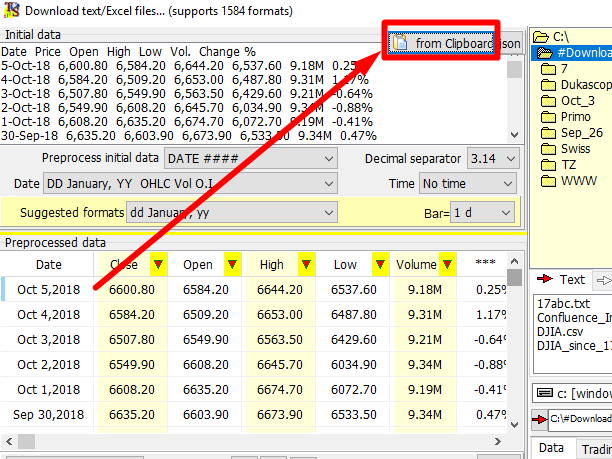
The only thing that you should take care of is the data format (see the section "Data Format" above).
This video class explains how to download the price history from websites:
Downloading data from e-Signal
You can use e-Signal datafeed if you have a subscription to their service. Make sure that you have e-Signal version 10.6 as Timing Solution only supports e-Signal 10.6 so you will need that version installed on your computer. The good thing is that you can have two e-signal versions installed on your computer: version 10.6 to work with Timing Solution, and the latest version if you need it as well. After that you need to run e-Signal 10.6 software "As Administrator". This procedure is explained in details here.
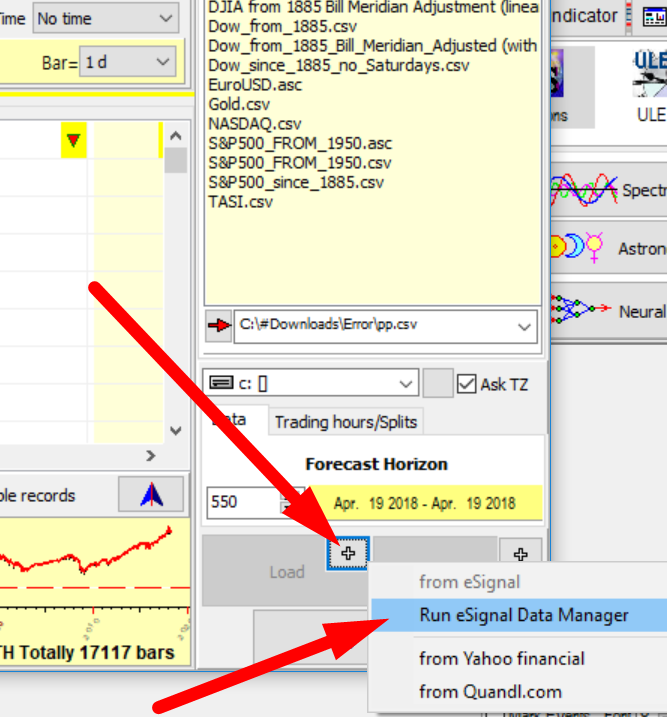
Now we are ready to use e-Signal datafeed. Click "+" button in the popup menu and choose there "Run eSignal Data Manager" item:
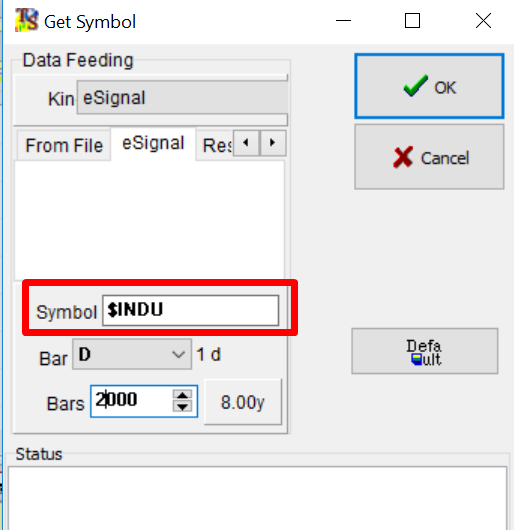
Wait for several seconds while e-Signal data manager is downloading. When it is done, the item "from eSignal" becomes available in the popup menu. Choose it, type e-Signal symbol there and click OK:
After that the program downloads the price history from e-Signal. As with other data sources, the program will ask you to enter the exchange location information and then it will transfer this chart into Timing Solution.
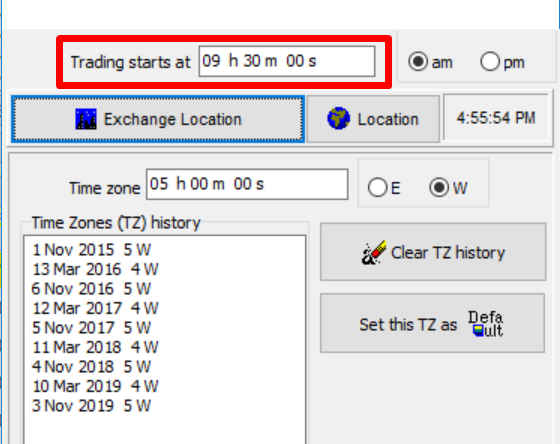
Exchange location information
When you download the price history, this dialog box appears:.
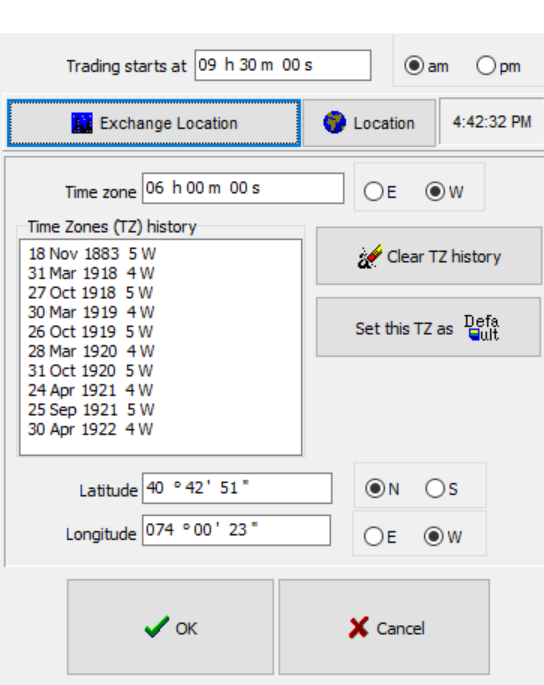
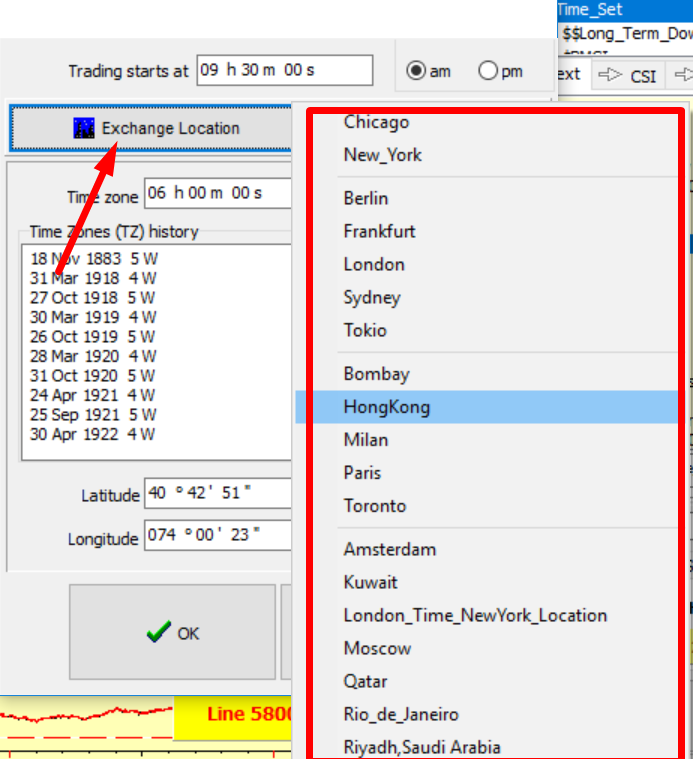
For accuracy of astronomical calculations you have to set the exchange location. It is a place where the downloaded financial instrument is traded. It is easy to do: just click "Exchange Location" button and find the proper location in the list:
If you are downloading daily data, it is necessary to set the time when trading begins. As an example, for NYSE you should choose New York exchange location and set "Trading starts at" 09:30
Trading hours
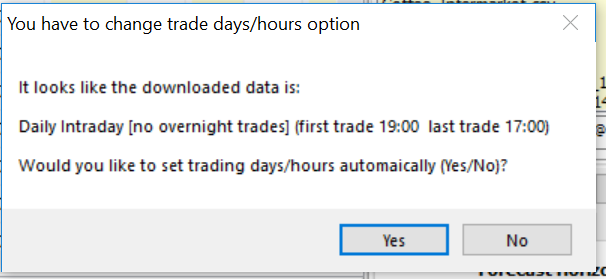
If you are using intraday data, you need to set trading hours; this information is necessary to generate the projection line.
In most cases the program specifies the type of downloaded price history data automatically. You will see this notification window with the information about your data:
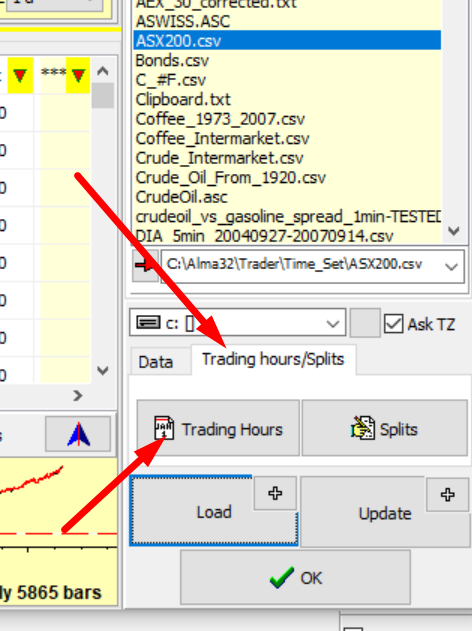
You can also set trading hours manually by clicking this button in "Trading hours/Splits" tab:
Date/Time/Data Formats
Different websites provide lot of financial/economical information. Here are some examples of price history downloaded from different sources:
16.06.2004 10380.23 10433.52 10320.60 10379.58 11684000.00 10379.58
17.06.2004 10378.59 10417.69 10308.25 10377.52 12967000.00 10377.52
18.06.2004 10375.82 10471.84 10328.20 10416.41 15006000.00 10416.41
21.06.2004 10417.82 10471.76 10336.44 10371.47 11239000.00 10371.47
...
0,20121019,8:00:00 PM,1.03233,1.03381,1.03197,1.03328,6037
1,20121019,4:00:00 PM,1.03597,1.03632,1.0318,1.03233,10070
2,20121019,12:00:00 PM,1.03534,1.03662,1.03505,1.03596,6152
3,20121019,8:00:00 AM,1.03639,1.03682,1.03474,1.03536,6399
...
8-Feb-18 "8,242.50" "7,585.00" "8,648.80" "7,579.60" 85.01K 8.64
7-Feb-18
"7,587.00" "7,679.40" "8,488.20" "7,175.10" 106.70K -1.13
6-Feb-18 "7,673.80"
"6,946.60" "7,860.00" "6,000.00" 192.76K 10.42
..
20170730,00.00.00,1.17456,1.17618,1.17443,1.17468,19254.2899918854
20170731,00.00.00,1.17469,1.18454,1.17231,1.18208,236964.979945607
20170801,00.00.00,1.18207,1.18389,1.17852,1.18109,226680.569859169
...
All these data use different date/time/data formats to store the information:
date format - the date may be shown as mm/dd/yyyy or dd/mm/yyyy or mmddyyyy or some other combination of the day, the month and the year,
time format - standard time notation may be used (9:45PM) or military time (21:45),
data format - OHLC price bar maybe stored like Date,Open,High,Low,Close or as Date,Volume,Close,Open,High,Low or in any other arrangement (and there are a lot of them).
There is a huge variety of different formats, and the unique feature of this module is that in most cases the program automatically finds date/time/date format applied for the chosen file. A special expert system analyzes 1584 different formats (as of April 2018, and we constantly add more) and finds the format that fits your data the best way. Therefore, in most cases you do not need to worry about formats, the program recognizes automatically the structure of data to be downloaded.
Sometimes it is impossible to recognize some format automatically. It happens if there is not enough price history, and the date/time/data format is uncertain. In this situation you may try setting these options manually:
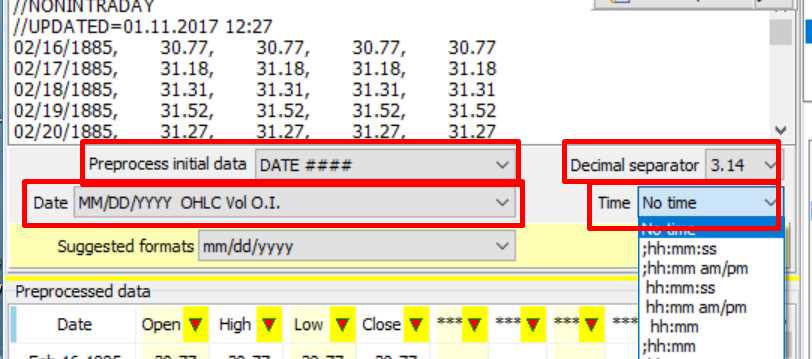
Pay attention as well to these yellow/red buttons, they allow to specify the data format:
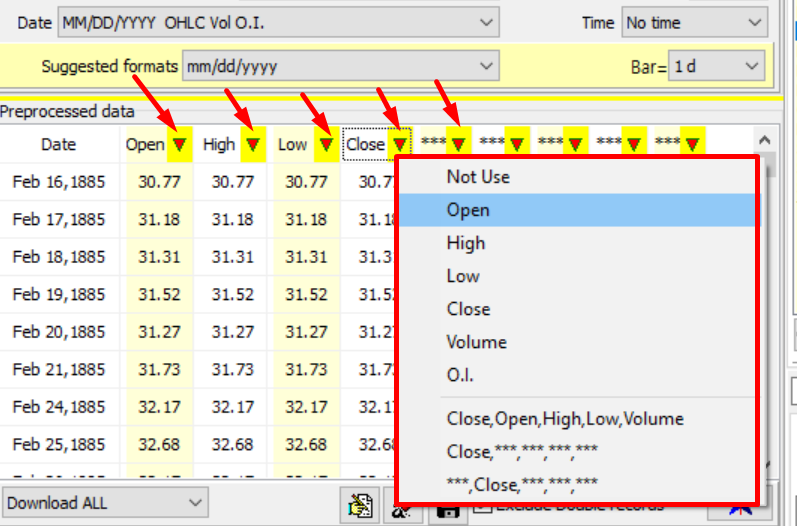
Clicking them allows you to specify a data format - the structure of the downloaded file. In the example above, the first column after the date is OPEN, the second column is HIGH, the third is LOW, and the fourth is CLOSE.
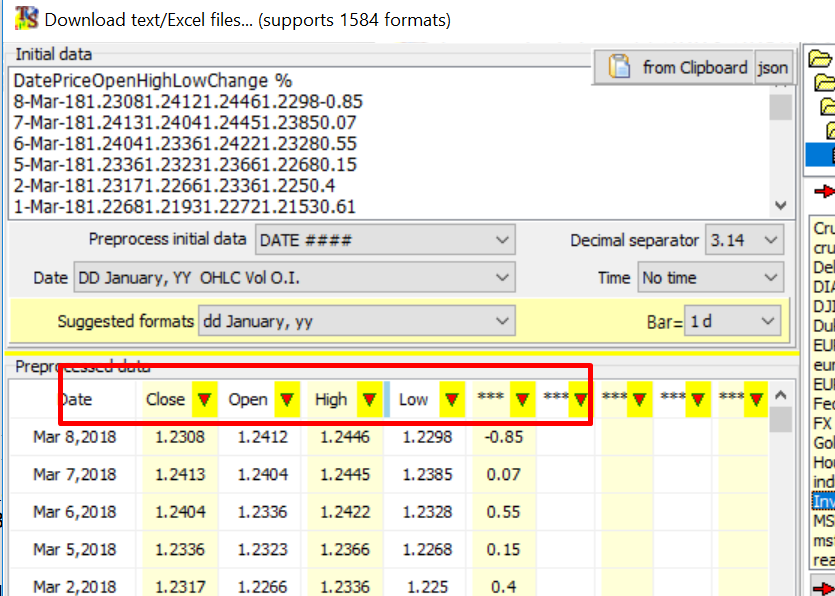
Sometimes we have a data file like this:
Date Price Open High Low Change %
8-Mar-18 1.2308 1.2412 1.2446 1.2298
-0.85
7-Mar-18 1.2413 1.2404 1.2445 1.2385 0.07
6-Mar-18 1.2404 1.2336
1.2422 1.2328 0.55
Here the first column is CLOSE, the second - OPEN, the third - HIGH,
the fourth - LOW.
In this case, specify the data format this way:
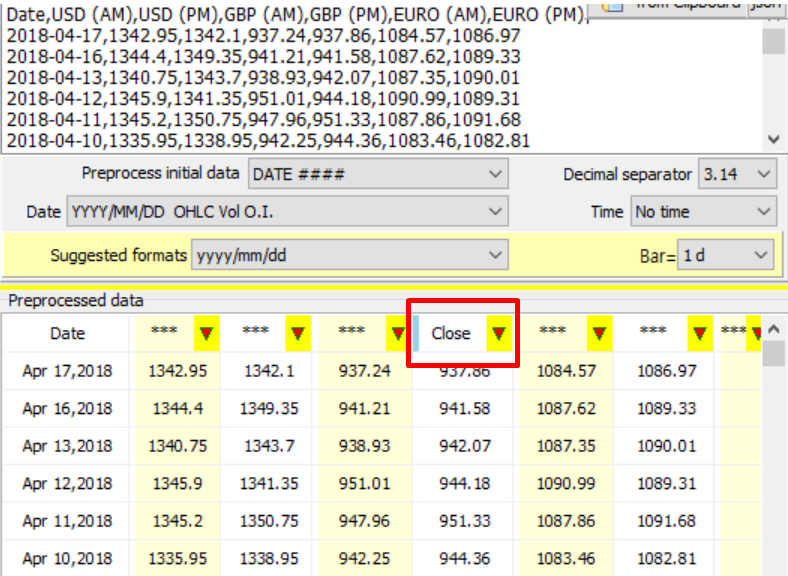
Here is another example: downloading from Quandl London gold fixing, we have got this:
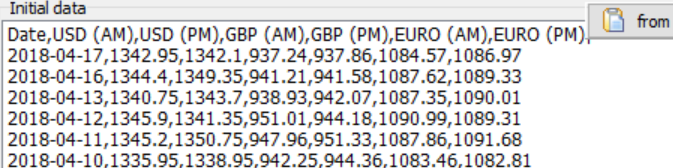
The first record after the date here is morning gold fixing price in $USD , the second is evening price in $USD, the third is morning price in GBP, the fourth is evening price in GBP, etc. Suppose we need to download evening gold fixing price in GBP and ignore all other records. You should activate fourth column only and ignore other columns:
Dealing with splits and corrupted records
Sometimes you will see this panel after downloading the price history:
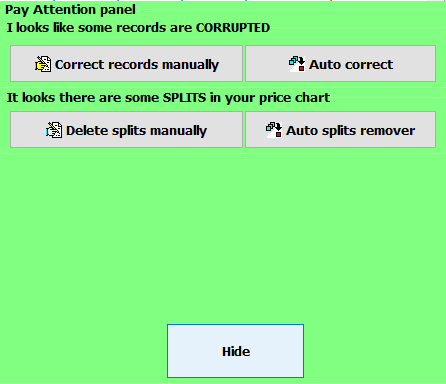
It appears if there is a problem with your data, and some action from you is needed.
The first prompt indicates that the price chart that the program tries to download has a chance of existence of some corrupted record(s). Click "Correct records manually" button to see this/these record(s):
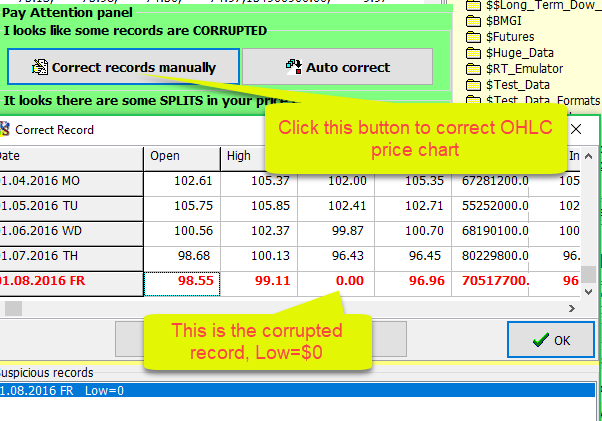
Or you may choose to fix these records automatically by clicking "Auto correct" button.
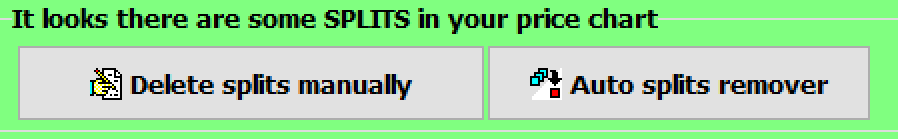
The second prompt indicates that it is possible that the price chart might have splits:
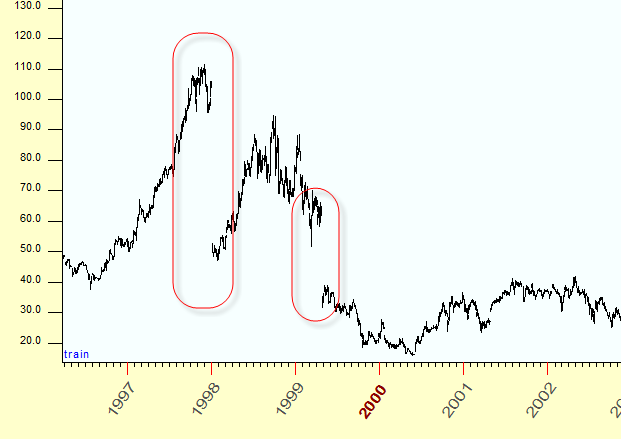
Usually splits look like gaps on the price chart:
You can run "Auto splits remover" button to handle splits in automatic mode. Or you can delete splits manually by clicking "Delete splits manually" button.
This is an example of how this module works. It indicates all possible splits in this piece of price history (totally 5 splits here). Here the gap in April 1968 corresponds to the split 2 for 1:
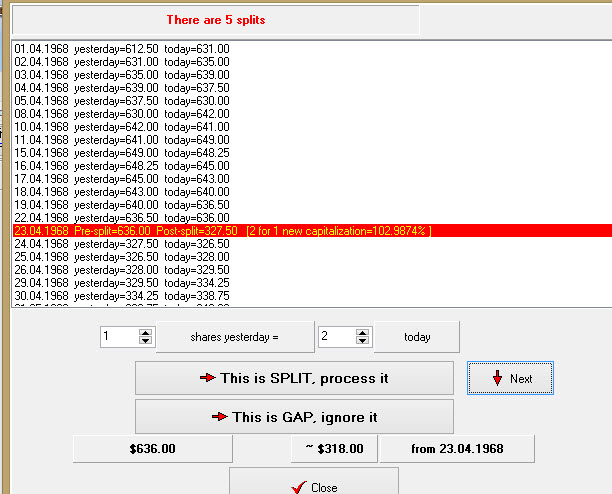
The information regarding splits can be found on companies' websites or in the news. The companies usually notify the general public about upcoming splits.
Updating price history
If you work with some financial instrument constantly, you do not need to repeat the process of downloading its history every time you work with it. You may just update the price history by adding the new information to already downloaded data. To do that, use these buttons:
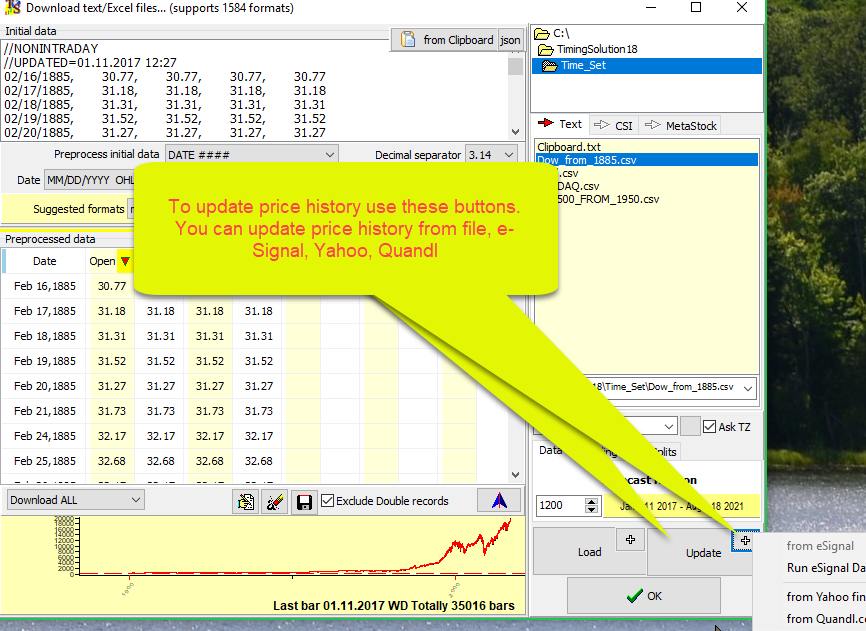
The program simply adds a new portion of price history data to the existing chart. Thus, you can combine the price history using several sources of data.
There is another possibility to update price history through TS worksheets. This feature allows to save your work with results provided by different Timing Solution modules; you can open the file with your work later and update price history to see how these modules work with new portions of information. This feature is discussed in the TS Worksheet section later in this lesson.
Making Calculations
After downloading the price history, click "Calculate" button:
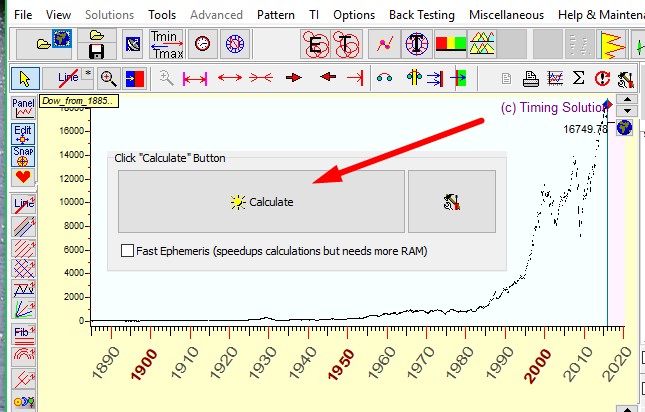
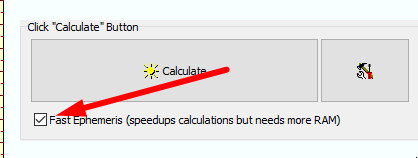
The program performs all astronomical calculations saving you time in the future, when you will look at different models - there will be no need to repeat the same calculations for every change in the model. To speedup these calculations, set Fast Ephemeris option ON, however it does require more RAM to do so.
When it is done, all modules of the software become ready to work with.
Price Chart Manipulation: Moving, zooming and maximizing the price chart
The chart manipulation tools are located on the second bar from the top:
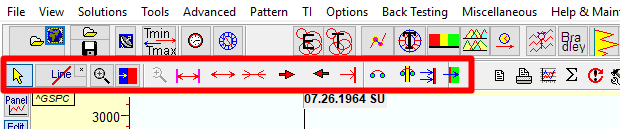
No matter what module you use, you need to orient yourself effectively around the price chart, therefore the buttons of this bar will be discussed in further detail below:
 The first button is your standard cursor button. It reverts the left mouse button (LMB) to its standard function.
 The button next to it allows the LMB to perform various actions. To select some action, click on the "*" in the top right corner of the button:
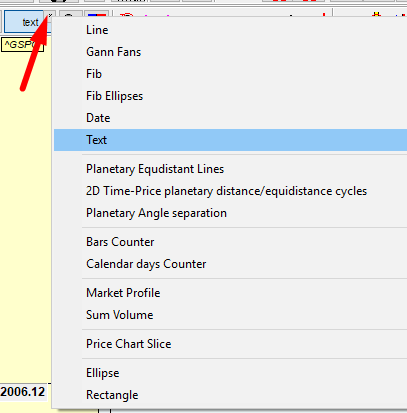
The mode is then displayed on the button name.
As an example, select the text option from the "*" menu if you want to place a text mark somewhere on the chart. Then you make a left mouse click where you want to place the text and enter it in the window that opens.
Also, you need this feature when you plan to draw several similar charting tools, like this chart with four Gann fans:
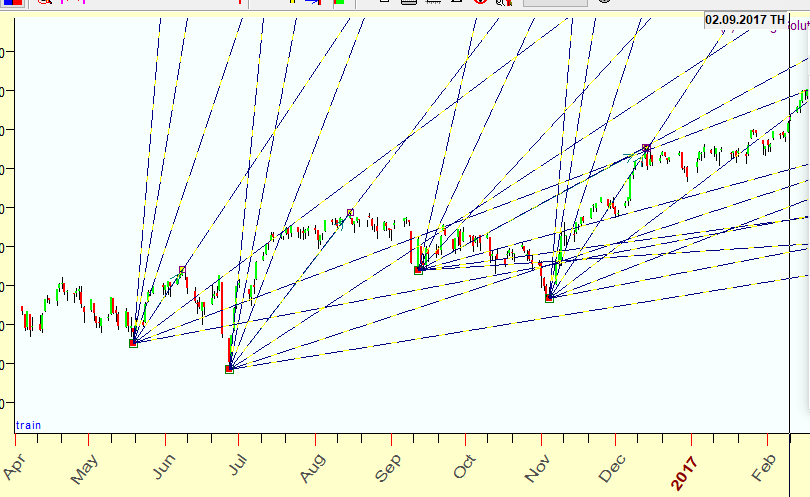
In this example Gann fans charting tool is selected as LMB action, and these four Gann fans are drawn with four mouse clicks.
 This button allows
to zoom in on the price chart using the LMB. This function is mainly reserved for the right mouse button.
In other words, you can select a piece of the price chart using RIGHT
mouse button. If you need, you can select this button to zoom in using the LMB
(LEFT mouse button).
This button allows
to zoom in on the price chart using the LMB. This function is mainly reserved for the right mouse button.
In other words, you can select a piece of the price chart using RIGHT
mouse button. If you need, you can select this button to zoom in using the LMB
(LEFT mouse button).
 The next button sets the Learning Border Cursor (LBC). This function is very important for testing any of the modules. When you set the LBC, the program uses price data UP TO that point for its calculations. This is very useful when testing your projection line. This button is a very important feature of Timing Solution and further reading on it is found here
For example: If you want to check how the price of gold will behave in 2018, you can set the LBC to January 2017. Then you can use any method you like to generate a projection line. Timing Solution does its calculations using market data up to January 2017 and generates a projection line. This allows you to compare the created projection line to the actual price movement of gold in 2017. It helps you in determining whether this particular method is useful in your prediction of the gold price movement in 2018.
 The next button is the un-magnify button. It zooms out the price chart to your previous zoom level. For example, if you have zoomed in on the last quarter of a price chart and then zoomed in again on the last few bars of the chart, clicking on this button returns you to the view of the last quarter of the price chart. It is essentially an undo button for
a zoom function.
The next button is the un-magnify button. It zooms out the price chart to your previous zoom level. For example, if you have zoomed in on the last quarter of a price chart and then zoomed in again on the last few bars of the chart, clicking on this button returns you to the view of the last quarter of the price chart. It is essentially an undo button for
a zoom function.
 This button looks at the entire price chart data that is currently downloaded into Timing Solution.
 This button zooms out from your current zoom level.
 It
zooms in a few increments into your current selection.
It
zooms in a few increments into your current selection.
 The next two buttons shift the view to the left and right.
 This button zooms in on the last few months of the price chart history. If you have set the LBC, then it zooms in to where
LBC starts. If there is no LBC set, then it zooms in to the end of the chart history.
This button zooms in on the last few months of the price chart history. If you have set the LBC, then it zooms in to where
LBC starts. If there is no LBC set, then it zooms in to the end of the chart history.
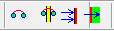 The next four buttons move the LBC on the price chart. The first button shifts
it one bar ahead. The next button moves it ahead in relation to the zoom level of the screen (the more zoomed in you are the smaller the shift). The third button shifts the LBC to the last price bar.
The next four buttons move the LBC on the price chart. The first button shifts
it one bar ahead. The next button moves it ahead in relation to the zoom level of the screen (the more zoomed in you are the smaller the shift). The third button shifts the LBC to the last price bar.
The fourth and the last button on the manipulation bar toggles the view of the price history after the LBC. This is useful as you might not want to worry about any price data after LBC while working on your model and then showing it once the program has calculated the projection line.
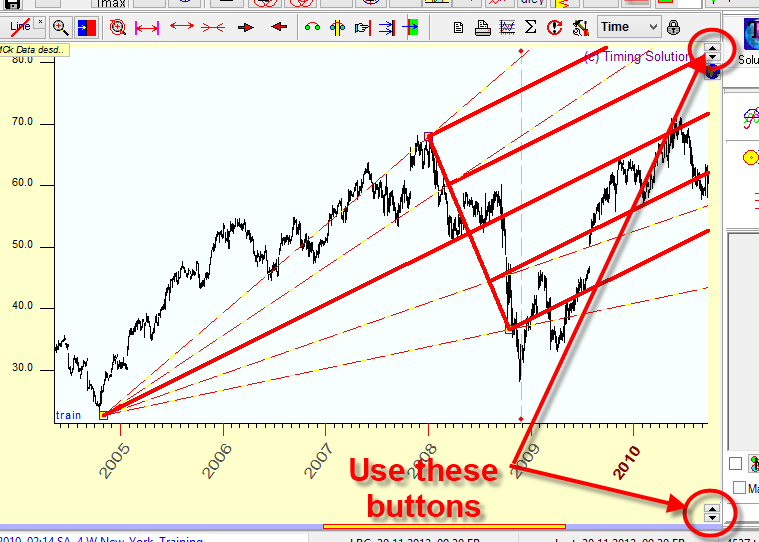
Top and Bottom Margins
Sometimes while drawing a charting tool we need more room to display the price chart. As an example, look at the picture below. Here, to display this pitchfork, we need to display the price chart using the price range $20-$80 while the program automatically uses a tighter range, $20-$70:
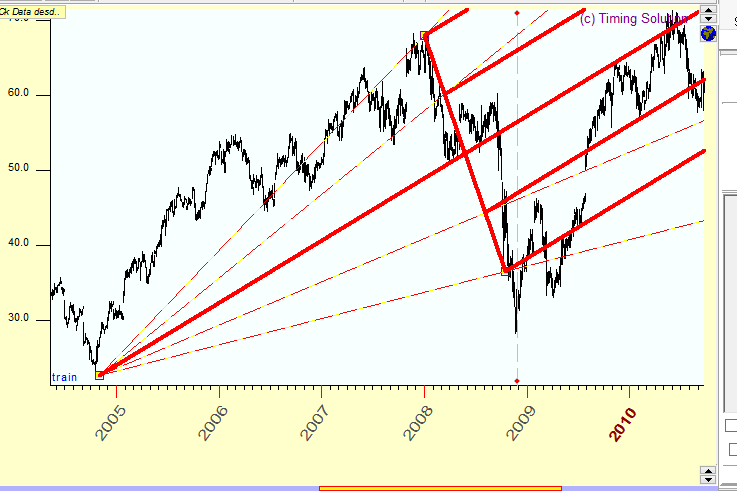
In order to increase this range, use these buttons:
Timing Solution worksheet
Usually, while working with Timing Solution, you apply many techniques. Look at the chart below. It represents the typical desktop window view with the price chart, two charting tools (Pitchfork and Fibonacci level), Annual cycle and Easy Expert module that shows the statistically verified effect of some astronomical phenomena:
You can save this work, and come back to it later by saving it as a Worksheet.
It is done by clicking these buttons:
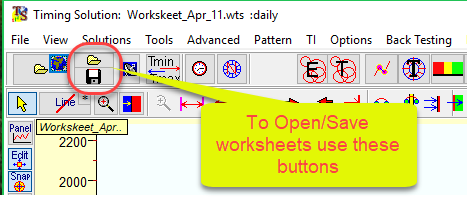
Thus you do not need to repeat your actions when you run Timing Solution next time; you will be able to get back to your chart whenever you want to.
Updating price history through a worksheet
When you save your worksheet, do not forget to set the way how the price history should be updated:
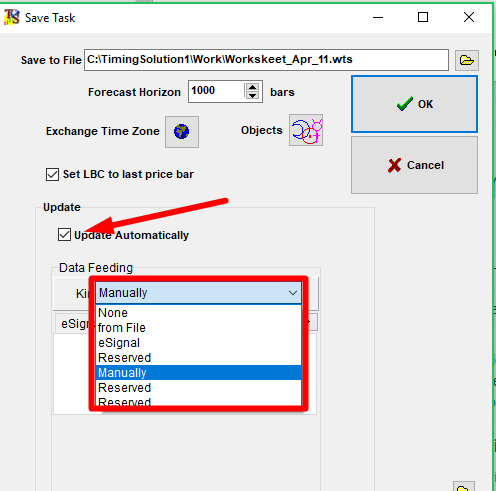
There are several possibilities there:
- "From File" - the price history is updated through the file, like
in MetaTrader or QCollector software. These programs save the
updated price history into some file, and Timing Solution uses this file to update
the existing price history. Many of our customers use this option to download price history
in real time from Meta Trader.
- "e-Signal: system
- "Manually" - choosing this option you will get the standard Timing Solution window to download the price history; here it is:
Thus you can update the price history from any file, clipboard, Yahoo, e-Signal. Use this option if you are not sure what data format is used (and not sure that the program is able to deal with it automatically) and you would prefer to control this process manually.
It works this way: you download price history in a regular way (it means choosing the file, or downloading from clipboard, or Yahoo/Quandl etc.), check OHLC data format and after that:
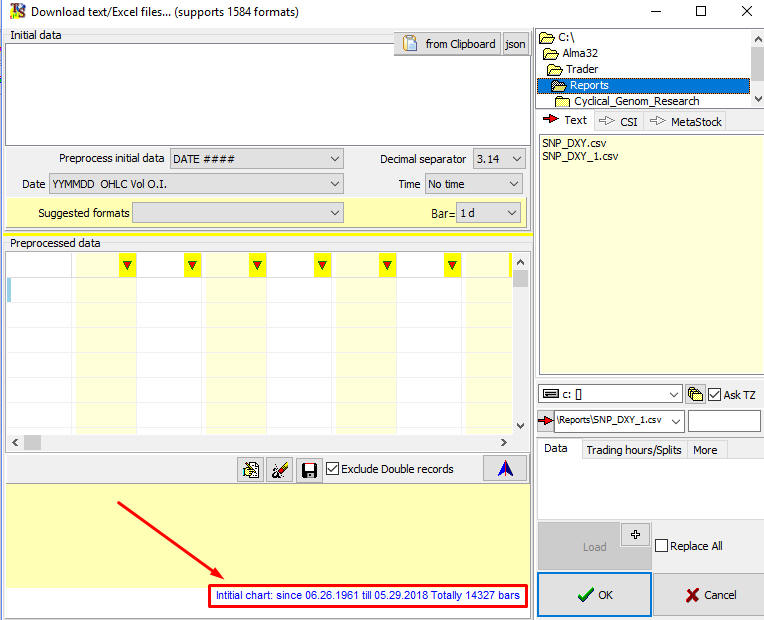
1) click "Load" button:
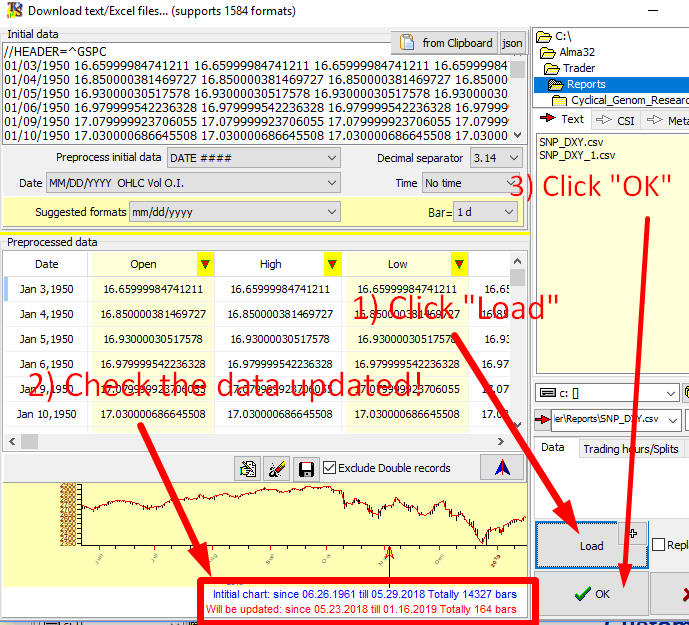
2) look at the information band in the bottom; it shows the initial (not updated) price chart and the piece of price history that will be added to this price chart;
3) click "Ok" to confirm your decision.
2) Customizing Main Window View
You can modify the way how the price chart and other objects are displayed in the Main Window. For that purpose, use "Main Window view" module clicking this button:
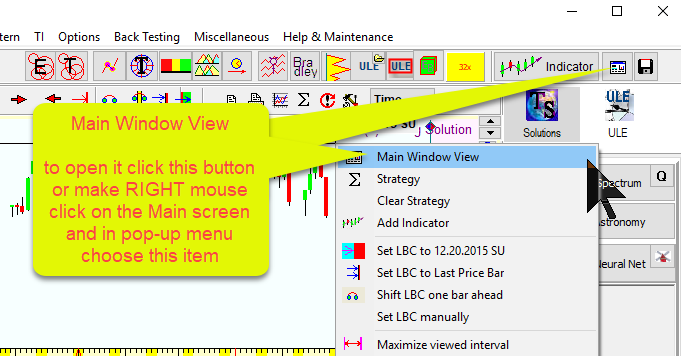
Here it is:
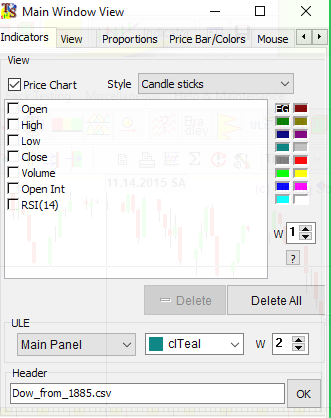
The window has several tabs. They are pretty obvious, and you can select the options that you prefer.
The very first tab, "Indicators" (shown above) works with Technical Analysis indicators (see the next item of this lesson).
Another tab, "View", gives you options to define such things as date and time format (which may not coincide with what Windows provides), margins (you can also set them right from the Main Window). You can define as well how you would like to see the time and price scales displayed:
For example, sometimes the time scale may have too many dates shown; you can make them positioned inclined instead of being horizontal.
Try other tab options. You will find many useful small things there, like choosing colors for candle stick body, line thickness, etc
Working with Technical Analysis Indicators
To create the classical indicators of Technical Analysis (like moving averages, RSI, MACD,ADX...) use this button:
There you will find a list of available indicators:
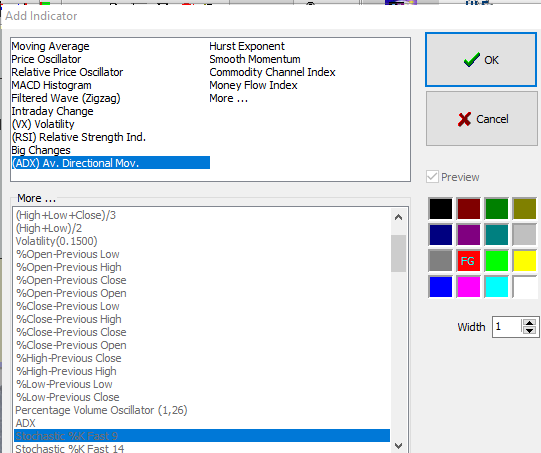
To modify the view of these indicators (like color, thickness) or to remove them, use "Main Window view" module. In example below we have created ADX indicator and have modified its color and thickness through Main Window View:
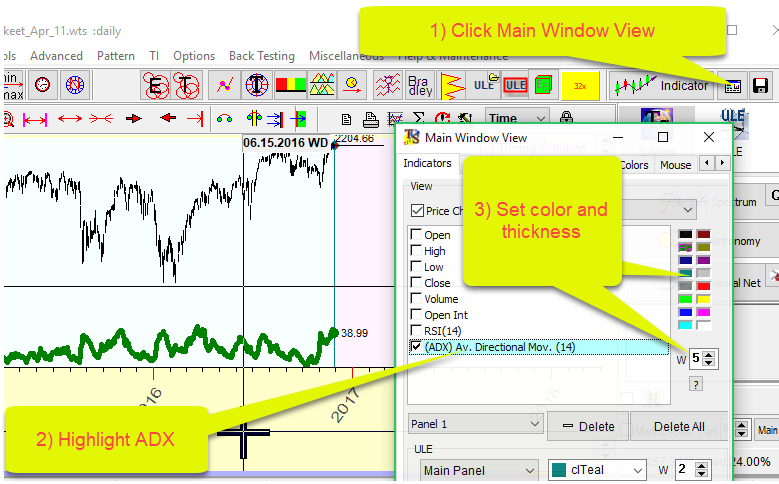
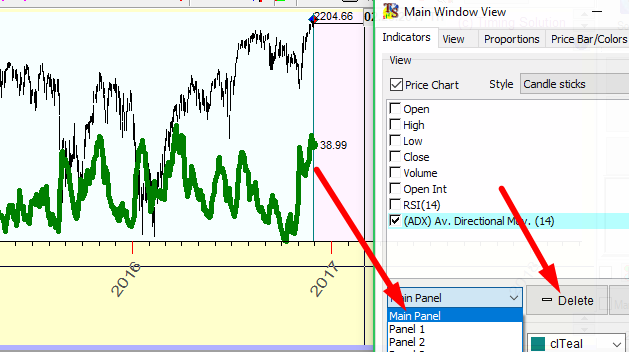
You can modify how ADX indicator is displayed in the same manner: overlay of the price chart or in a separate panel. Clicking "Delete" button takes away this indicator from Main Window:
If you want to make some Technical Analysis (TA) indicator/indicators as "default", i.e. expecting that after downloading the price history the program automatically builds this indicator, click this button:

Let say you always want to see ADX indicator after downloading the price history. Instead creating it every time, click on this button. This indicator will be created every time you download your price history.
According if you do not need to create any indicator/indicators after downloading price history, delete this/these indicator/indicators as explained above and click this button again.
Working with Charting Tools
Timing Solution gives you a possibility to work with a huge variety of charting tools. Here you can find popular and simplest charting tools - such as trend lines, Andrews pitchfork, Fibonacci levels, Gann fans, etc. Moreover, we provide a bunch of new charting tools, or "smart" charting tools, that are quite simple in use while having complicated math behind. You can read more about them here: http://www.timingsolution.com/TS/Study/ts_charting_tools/index.htm
To draw any charting tool, follow these steps:
This is a sample of Andrews pitchfork:
Using LEFT mouse button, move the anchors of this pitchfork:
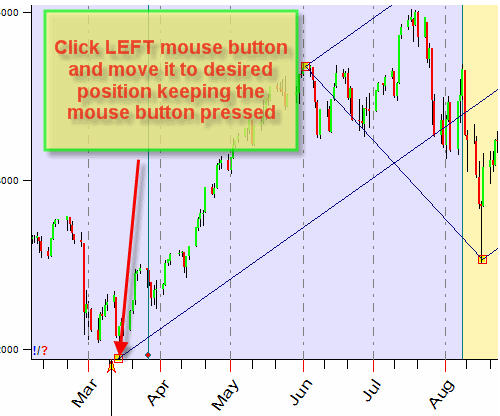
In the example above, we moved one point (anchor) only. However, it might be necessary to move the whole
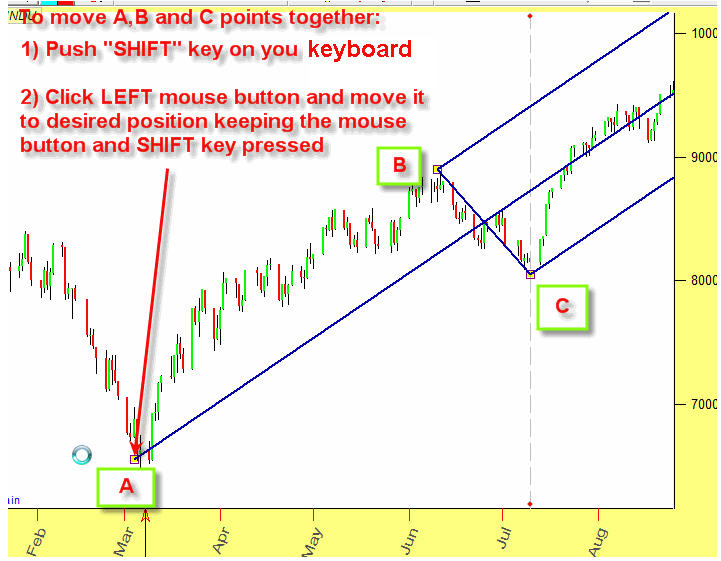
figure, i.e. moving all points A, B and C.
In order to do that, do the same as above for moving the point A, while
keeping the Shift button on your keyboard pressed. Thus you can move the
whole figure:
To modify the parameters of the pitchfork that is already created (you can see it on the screen), click RIGHT mouse button and edit the parameters in the window that pops up
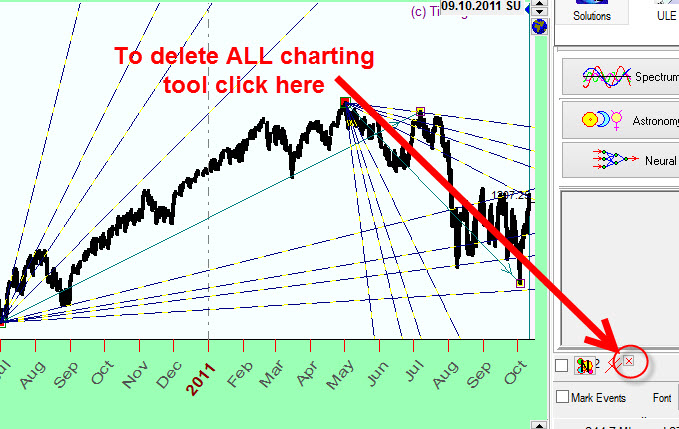
Deleting charting tools
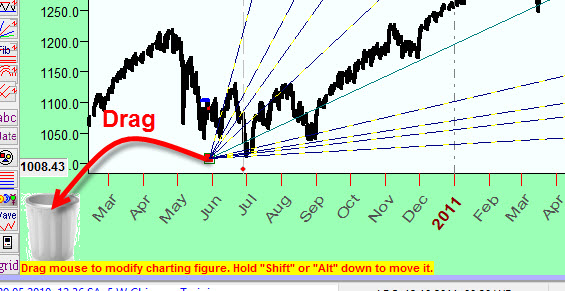
To delete ALL charting tools at once, click this small button in the right bottom corner:
If you want to delete only some of the charting tools that are on your screen, do so by dragging them one by one to the garbage bin in the left bottom corner of the price chart:
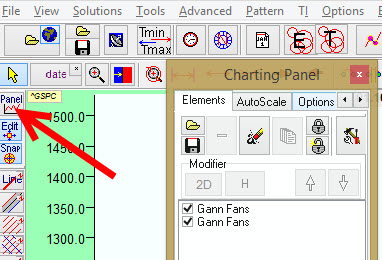
You can also delete the charting tools through the "Charting Panel" window:
This is the end of this lesson. There is a lot of information that is covered in this lesson, and you might return to it later on as you learn more about Timing Solution. You can use the menu at the top of the page for quick access to the section you want to read about. In the next lesson will talk about a very important concept of Timing Solution called the Learning Border Cursor