Turning Points Analyzer module - ten years later...
written by Sergey Tarassov
Introduction
This is a module with some history. It has been created 10 years ago (in 2005); then I have received a lot of wishes and notes regarding this module. Many new features have been incorporated there, and now a new version of this module is released. When this module has been developed ten years ago, it was more a research tool. Now my focus was to emphasize and simplify features that are most important for traders.
You may like to see previously written articles about this module:
http://www.timingsolution.com/TS/Articles/waves_in_moon/waves_in_moon.htm
http://www.timingsolution.com/TS/Articles/tp_1/tp_1.htm
General idea description for busy people
In this module we employ a scientific approach for finding price levels where the price movement tends to change its trend, or CIT points (CIT stands for change in trend). In other words, we try to identify support and resistance price levels.
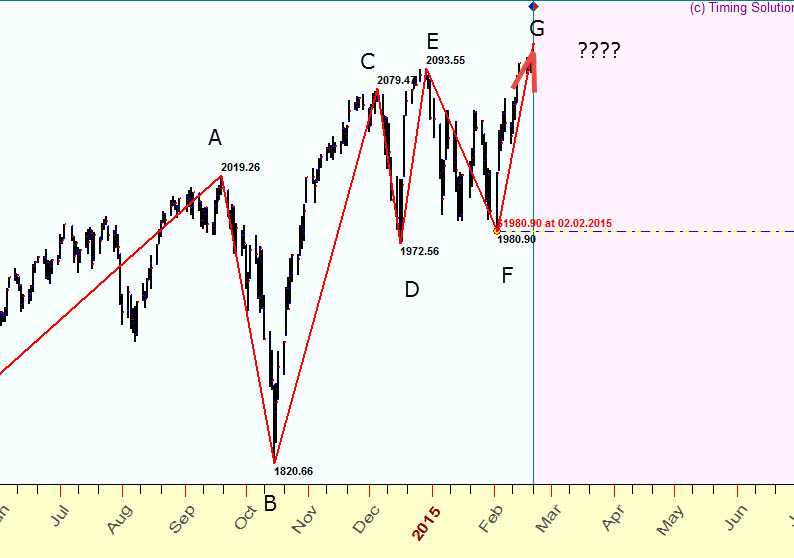
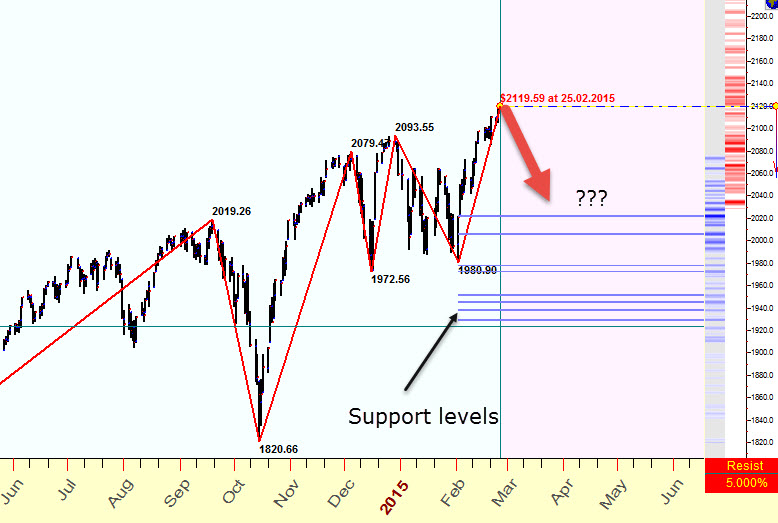
Look at the price chart for S&P500. There are six the most important turning points for the last six months: A-B-C-D-E-F. The question is: how to find the price level for the next turning point G?
In terms of classical tools, we may try to solve this problem using Fibonacci grids charting tool. We take a previous swing E (price 2093.55) - F (price 1980.80) as a basis (100%) and calculate other price levels using classical Fibonacci levels, like these:
100% level = F (1980.90) +100% ( E(2093.55) -F(1980.90)) = 2093.55
61.8% level = F (1980.90) +61.8% ( E(2093.55) -F(1980.90)) = 2050.52
etc:
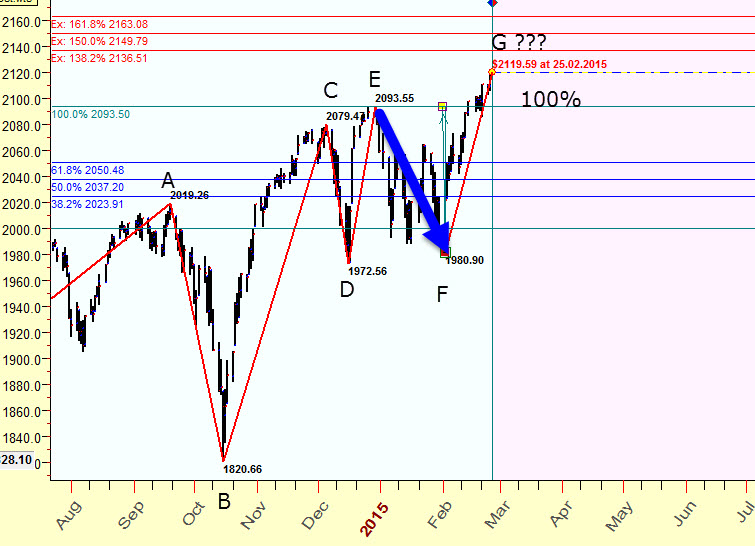
In other words we try to calculate the height of the next up swing using the height of previous down trend swing E-F.
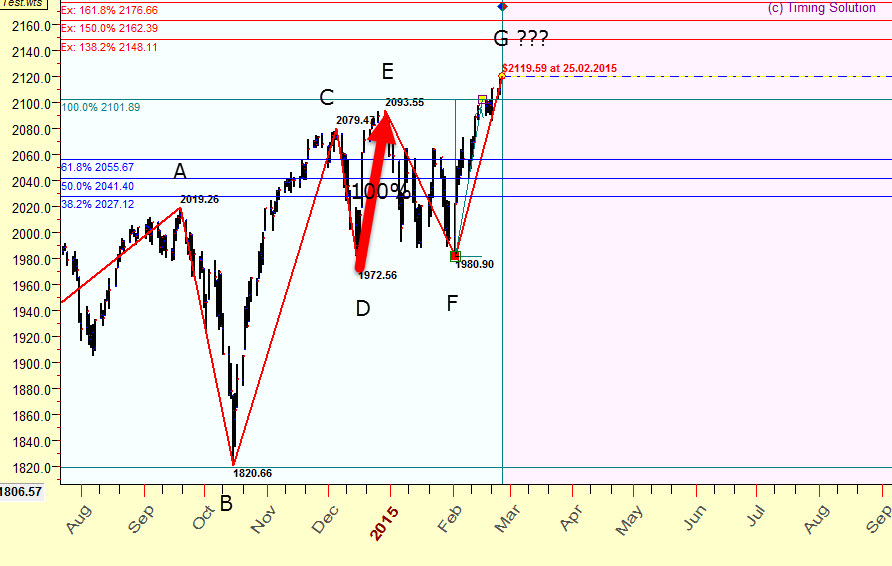
The same manner we can try to find these price levels using as a basis previous UP trend swing and calculate other price levels:
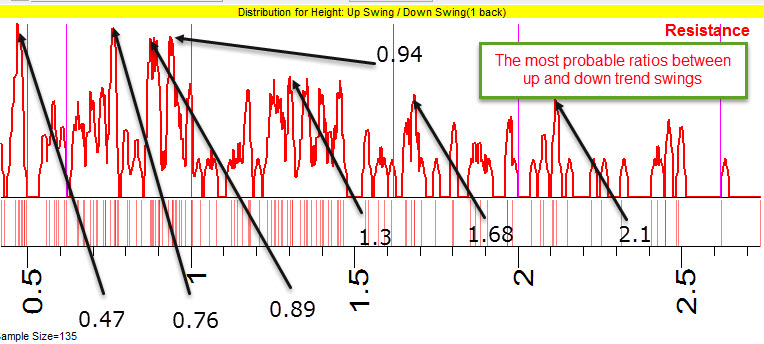
Computers give this classical task a new breath. In this particular example, using the price history for S&P500 since 1987, the program analyses all turning points (305 CITs in total) and specifies the most probable ratios between the up trend swing and a previous down trend swing. Totally there are more than 150 up trend swings, and look what statistical analysis says to us:
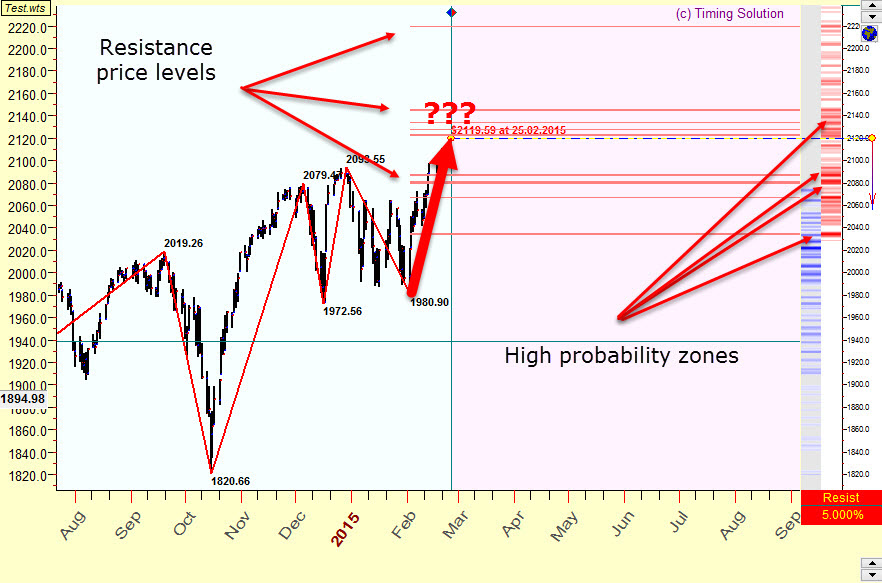
Here the colored diagrams in the right corner of this chart show the most probable price levels where the price tends to change the trend from up to down trend. The bright RED zones correspond to the most probable zones - the zones where trend changes are more often than in average.
Accordingly we can calculate resistance price levels from this high probability diagram - these are displayed as red horzontal stripes. This is a ready-for-use trading tool that emphasizes the most important price levels.
Instead of Fibonacci ratios, we can conduct the formal math analysis, and it gives us different ratios between up and down swing waves. Here they are, calculated for this financial instrument:
The same way we can calculate support price levels, they are displayed as blue vertical stripes:
The same math procedure is used here: we analyze the ratio between down and previous up swing and this way reveal the most probable price levels where the price tends to change its trend from down to up.
There is one very important nuance here. Please look at this:
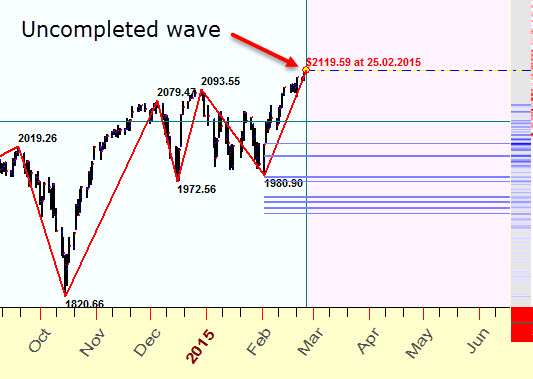
You see here that the last wave is not completed. And we do not know exactly whether this is an actual TOP turning point or the price may continue to move up further, so the TOP will be higher. We have to wait for the opposite (downtrend) movement to get a confirmation that this is an actual TOP turning point.
In other words, in this case we can get a conditional forecast only. Take it as: "If February 25, 2015 is really a TOP turning point, we would expect the next BOTTOM turning point at the level ...". This is a problem of the last unconfirmed swing.
Please note that in the program high probability zones for a forecast based on uncompleted zigzag are displayed on a gray background:
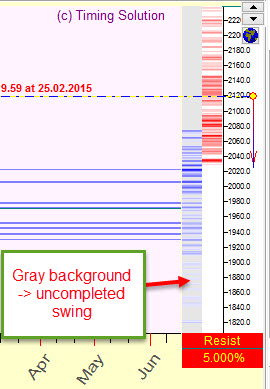
Be very careful with the forecast based on the last unconfirmed swing; the high probability zones can changed when the new piece of the price history comes. In other words, in this module we always have two sets of levels: one is based on a confirmed swing while the other is based on an unconfirmed swing.
Options
Handling turning points
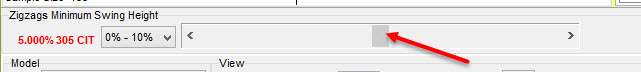
First and the most important parameter is min swing size (calculated in percents) for zigzag that is used to reveal turning points. You can adjust it using these controls:
For intraday price chart this parameter should be smaller while for weekly or
monthly chart it is bigger. Try to play with
this parameter to figure out what zigzag is better for you.
Also pay attention to the amount of analyzed turning points here:
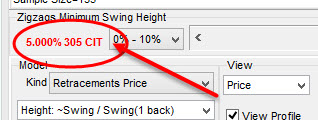
For valid
statistical analysis it is necessary to have
50 turning points at least.
Handling support/resistance levels
In most cases the program reveals the most important levels automatically. However, sometimes for better results some action from your side is necessary. Start playing with the amount of revealed levels changing this parameter:
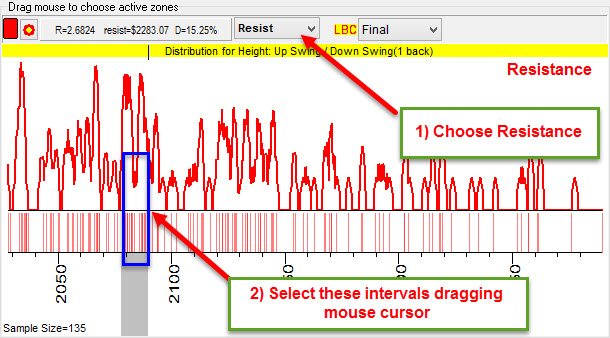
Sometimes it makes sense to pickup these levels manually. As an example the program did not reveal these price resistsnce levels around 2080-2090 that look like important:
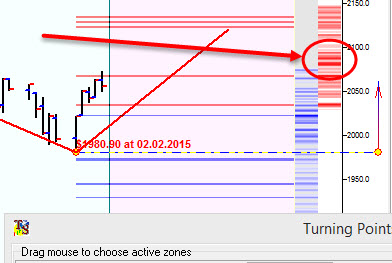
In order to display these price levels in the Main window 1) highlight "Resistance" item to display high probability diagram and 2) select this price interval dragging the mouse cursor over high probability interval:
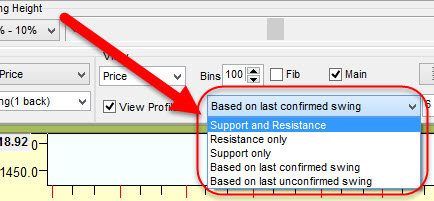
Using these options you can display in the Main screen only support, only resistance levels or both of them:
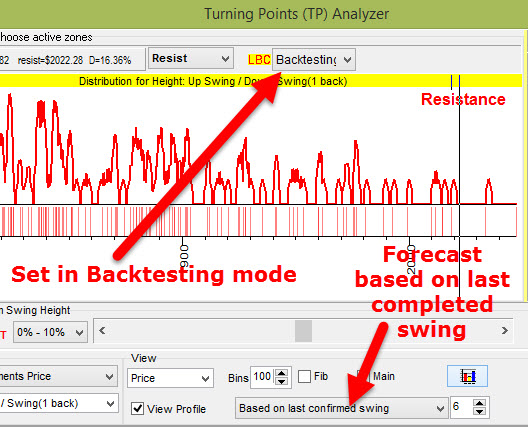
Backtesting
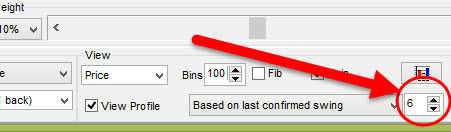
We recommend to conduct some backtesting of this module to figure out how it works with real live data. In order to do that, you should set this module in backtesting mode. It makes sense to display a forecast based on the last completed swing only:
After that try to vary the LBC and watch how these support/resistance levels catch real turning points. Look at this example; here we set LBC in the beginning of June 2014 and have found that these price levels catch two important turning points:
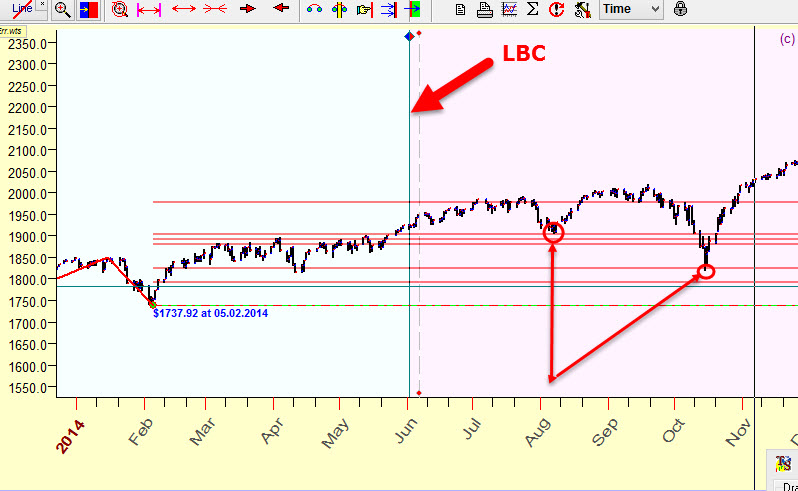
More about non future leaks technology see here: http://www.timingsolution.com/Doc/level_1/3.htm
Sergey Tarasov
March 2, 2015
Toronto, Canada