Stock Market Metrics
Recommendation for Timing Solution users
There are some issues that always were of a special interest to me. These issues are not only fascinating, they are very important themes of my current activity as well as they are important for the future development of Timing Solution software. I am speaking now about the cycles based models. Actually this subject was my main interest during my scientific career; and this interest, totally unexpectedly, led me to the analysis of the stock market behavior. This question has fascinated me when I was a child: "What is Time and Space?". Just think about what we - as a mankind - have achieved. We can explain how the television works, we have changed the Face of the Earth with the traces of our activity (planes, trains, cars, plants, mines etc.), we have sent rockets to the space - as far as Mars, Jupiter and Saturn, we are able to see what is going in the micro-world, we can create models that explain what is going on inside the high energy particle accelerator... And though we still do not understand many things out there, there is always a possibility (at least a theoretical one) that we will know one day, that we will be able to study these phenomena in depth. I would call these phenomena - study-able phenomena. It brings back that same main question - what is Time and Space? I would say now that this is kind of Home where these phenomena appear. How to study this home if we live in it, too? We can explore and describe everything that is inside of this home, but we cannot explain what the Home itself is.
Similar to that, the time shown by my watches is not the Time, this is just a measurement of time. It is the same thing as 36.6 Celsius degrees for the temperature of our bodies indicates that we are in good health, but it is not Health yet. St. Augustine said almost two thousands year ago: "When somebody asks me about time, I think I understand what the time is, though when I start thinking about the Time, I recognize that I do not know what the Time is".
In 21st century, we can only confirm these words. now is to measure the time. We still do not know what the time is. All we can do is to measure the time. And here the metrics issue appears.
Technically speaking the metrics is a method of measuring the distance between two points. If we speak about distances in Space, we have well-known meters, kilometers, millimeters - or yards, miles - depending on the chosen metric system. If we consider time "distances", we have time metrics. For example, the distance between two turning points dated as March 6, 2009 and July 10, 2009 is 126 calendar days. And here also we can deal with different time metric systems.
Ancient people adjusted their lives in regards to the Moon cycle. If they would measure the time distance between these turning points, it would be four Full Moons, to be exact 4 and a quarter of the full cycle. Modern astronomers know that Mercury and Venus have their own phases as well, therefore we could calculate that same distance in the amounts of Full Mercuries or Full Venuses. Mercury has changed its phase within this period for 407 degrees, as an example. We could also use the change of the Sun (or any other planet) position as a measure of the distance between two points.
Look at this chart. It shows the distance between these turning points measured in different ways:
Why this is important? Look now at the prolonged cycles: 126-days cycle (black stripes), 407 degrees Mercury phase cycle (red) and 137 degrees Mercury geocentric position cycles (blue).
As you see, these cycles point at different situations on the stock market:
In other words the cycles that show increments of 126 calendar days (black), increments of Mercury's phase of 407 degrees (red) and increments of Mercury's geocentric position of 137 degrees (blue) provide different projections.
See below the projection lines based on these cycles:
As you see the method of measurement of the distance between two turning points highly affects the forecast. Using the same initial turning points, we can get totally different projections in the future. This is why the issue of metrics is important.
We can take a metrics as the UNIVERSE in which our cycles live. In this Universe the time is measured not in minutes/hours/days/years (as in everyday life), but in some different way. In our example the time is measured in Mercury phases. For example, the habitant of this Universe can say something like this: "we have waited for you for the whole degree of Mercury's phase! Why are you so slow?".
There are two important things here: understanding that metrics can be considered as TIME metrics (not only SPACE metrics) and recognition of special kinds of time. Sometimes this time can flow backward, and we are back to the past to finish some unfinished task (like in the case of Mercury geocentric position time). The regular events that look as ideal sinus curves in that Universe can look very irregular in our Universe.
Look at this diagram once again:
You see how these ideal sinus curves actually look in our Universe. For example the ideal sinus curve in Mercury's geocentric position "universe" looks in our Universe as the green irregular wave from the picture above.
This is important: we are looking the Universe where the Chaos of the stock market behavior shows some Order. The things that are hidden by Chaos in our regular Universe become more clear in this artificial Universe.
In Timing Solution we can apply the whole set of forecasting techniques for any artificial Universe. For example, we can calculate a dominant cycle in Mercury's geocentric position time, like on the picture below.
This is a spectrogram; it shows the presence of 123-degrees dominant cycle in Mercury's geocentric position time:
In other words the price tends repeat its pattern every time when Mercury travels 123 degrees. We can drag and drop this cycle to the Main screen and calculate the projection line based on this dominant cycle.
I think the cyclic models will be developed in this stream: searching the metrics that reveal some Order in the stock market Chaos.
In regards to all said above, I would like to share with you something else. I am happy to be familiar with two great scientists who works in a similar direction.
One of them is Russian well known scientist, Simon Shnol. He has spent a lot of time researching fine structures of the distribution of data for a wide range of physical processes (like radioactivity of 239Pu preparation). According to the theory, this radioactivity should be normally distributed and none of any physical processes (like temperature or pressure) can affect this distribution. This is considered to be a very stable process, so we should expect here nothing more than a practically ideal Gaussian bell. In reality we have very different pictures like these:
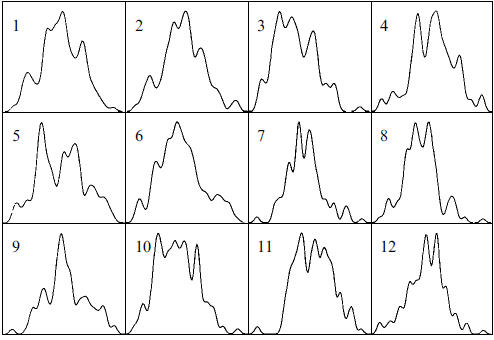
These distributions are a way too far from boring Gaussian bells, they have their own structure - fine structure. Besides having some periodicity, these pictures often repeat themselves with a period of 24 hours, i.e. this effect has cosmo-physical origin.
The most important feature of Shnoll effect is the fact that it cannot be explained by some direct physical influence, this effect is much more delicate. It looks like we deal here with something that changes time/space continuum, some irregularity in this continuum. In other words, what we have considered as our time/space home is not so entirely stable. According to the modern science, the significant change in this time/space home can be caused by a huge gravitational force - like the existence of a black hole nearby, definitely not by the forces that exist in Earth laboratory conditions.
So far there are too many unclear things here, beginning with the methods of formal verification (I helped to Dr.Shnoll trying to find the most appropriate math, not an easy task at all). In any case the subject of the research here is our time/space home.
This is picture of Simon Elievich Shnol and his wife, these great people:

Another person is a great French scientist Maurice Allais (I did not know him personally, he was friend of Simon). He has died in October 2010, being 99 years old.
He is a Nobel Prize winner in economics (1988). And there is a thing he has worked on almost all his life. In 1954 he studied the oscillation of pendulum during the Solar eclipse. The fact is that there are anomalies in pendulum movement. It looks like in this case we deal with irregularity of Space ("space anisotropy"). This work is not completed.
You can find more information about Shnoll and Allais effects in the Internet. The main conclusion for me is the fact that it worth trying to play with alternative metrics and that we can work with these metrics the same way as with the regular time. Possibly we can speak about personal time or about stock market time, and this is not a formal abstraction only, this is something very real. It looks like Shnoll and Allais effects revealed that our time (Shnoll)/ space (Allais) home is not something that is practically unchangeable (according to the modern science, this time/space home - or time/space continuum - can be modified by either a huge gravitational force like Black Hole or in the huge time scale like Galaxies' existence). There are some other things in play. Speaking philosophy's language, this is not just an abstraction that allows us to do some calculations in an easy way, - this is some entity with its specific ontological status.
Recommendation for Timing Solution users
You can use the regular spectrum module to calculate cycles based on alternative metrics. For example: to calculate spectrum based on the Moon phases follow these steps:
You will get a spectrogram like this one:
The peaks on this diagram correspond to the most powerful cycles that exist in the Moon phase metrics; this is why the period of these cycles is shown in degrees of the Moon phase. In this particular case, there is the highest peak of 1447 degrees of the Moon phases cycle. In other words, according to the spectrogram, the stock market tends to repeat its pattern every time when the Moon changes its phase on 1447 degrees:
Specially developed for this purpose fast algorithms allow to perform these calculations fantastically fast. Now you can use the standard "drag and drop" technology to calculate the projection line based on this cycle: simply drag and drop this cycle on the Main screen, and the program will calculate this projection line practically immediately:
Also, specially for that purpose Events Box module is developed ( http://www.timingsolution.com/TS/Mini/62/index.htm). This module allows to generate projection lines based on many cycles that include different planetary combinations.
To collect these cycles, drag and drop them from spectrum into Events Box module this way:
The beauty of this approach is: you can collect as many cycles as you need and clicking "Optimization" button calculate the projection line based on these cycles. Do it this way:
The same cycle in different metrics technology
So far I have no ultimate recipe for finding the most relevant metrics for the chosen financial instrument. Maybe it makes sense to research the cycle with the same period though in different metrics. I will show how it is possible to do that.
In our example 1447 Moon phase degree cycle approximately corresponds to 118-days cycle (approximately because this is an irregular cycle):
The next cycle to be researched is 359 degrees Mercury phase cycle; it has the period of 115 days:
So we try cycles with periods around 110-120 days applying different metrics for them. And we create Events Box model for each of these cycles, something like this:
Here the red curve is Mercury geocentric position cycle, blue - Moon phase cycles, green - Mercury phase cycle and black - regular cycle with fixed period. Simply watch what cycle works better.