Science of forecasting
Written by Sergey Tarassov
In this article I would like to explain the difference between Timing Solution (TS) software and other software packages available for financial analysts, traders and investors.
From one side, these are Technical Analysis (TA) software packages like Trader Station, Metastock, Wave59 etc.; from the other side, these are mathematics (Math) packages for researchers (like Mathlab, Maple, Wolfram Mathematica).
Vendors of TA software need to provide maximum data feed sources and the procedures to deal with brokers as you need to see price charts for all financial instruments you like to trade. It is a common image of a trader as a person surrounded by several monitors with real time quotes. You (the trader) need as well to manage your trades and conduct some quick research mostly based on technical analysis indicators. For anything else you practically do not have time.
Speaking about math (Math) based software, you expect to see diagrams and tables that allow you to see the stock market behavior in more depth.
Timing Solution is another kind of software - not TA software and not Math software. Our main focus is FORECASTING; and it is impossible to do this job using both TA or Math software.
It is impossible to do with TA software as the calculations provided by Timing Solution are much more compounded than those that TA can do. While making a forecast, Timing Solution takes into account much more parameters. For example, Composite module (that allows to reveal and back test astro cycles in financial data) contains at least 200 different parameters. If you try to build a code that includes such amount of parameters using scripts like EasyLanguage in Trader Station - it will be a huge code, and it will work very, very slow. Add to that a problem of setting all these 200 parameters the best way. This is a huge job. I am working on it (just for this module!) 20 years already, and still there is a room for improvement.
At this point, Timing Solution appears to be closer to Math software, though I need to mention once again not quite. Math based software allows you to generate the projection line; this is correct. However, if you want to build the projection line suitable for trading - it is not enough. You need something else, you need something more. Math based software solves tasks that mathematicians and scientists are used to solve - looking for general trends, correlations etc. of the events that have already occurred. For trading you need something different: the software that explains something in the past is one story, while the software that forecasts future price movements is a totally different story - because you plan to invest your hard earned money using this forecast. It requires another, and very specific mathematics, and standard mathematical procedures will not help you here. Believe me, I know what I am talking about. In my scientific past at the nuclear research facility, I worked a lot with math based software solving different tasks as a physicist. We can call this branch of mathematics FORECASTING or PROGNOSTIC mathematics. Timing Solution apples ideas of this forecasting mathematics.
In this article you will find two examples that give you a sense of a specific smell of this forecasting mathematics. First example shows astro based cycles, second - regular cycles. I should add that this article is addressed to all interested persons, especially to Timing Solution users: I hope it will help them to understand the important things and to see the difference between simple curve fitting and the forecast.
Example #1 Forecast-ability versus Curve fitting: Let me start with Annual cycle. Sometimes seasonal cycle works quite well, sometimes not. This is a fact. The question is: can we analyze somehow the periods when Annual cycle works good enough and periods when this cycle does not work? Who knows, may be there is some regularity in these workable periods.
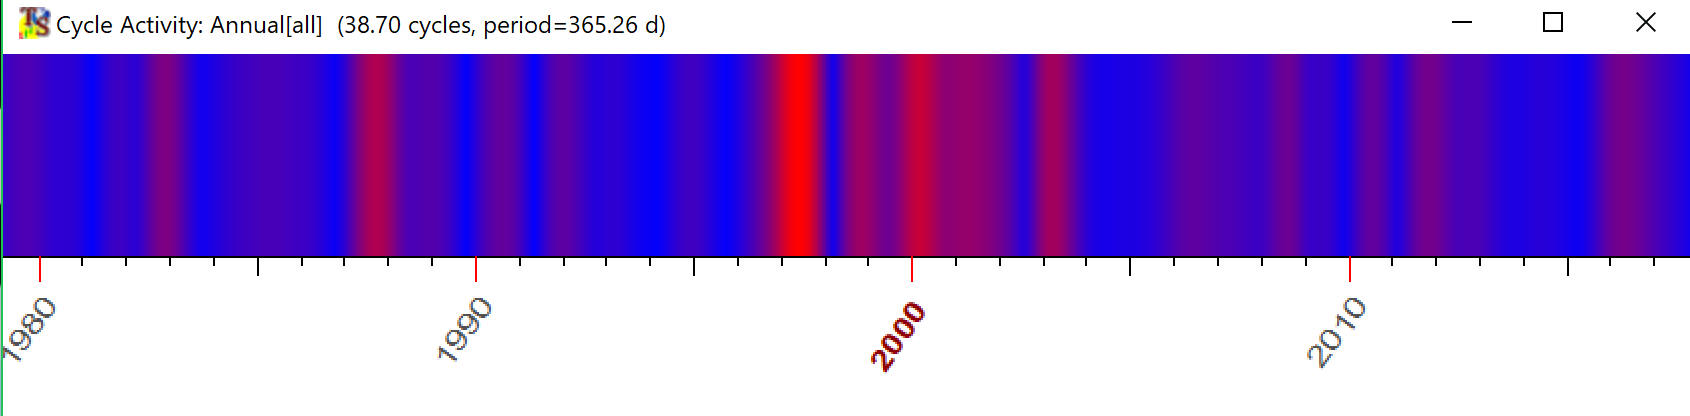
20 years ago I would solve this task using wavelet analysis, no doubts. This is the wavelet diagram for Annual cycle:
The red regions there show the periods when Annual cycle was strong, while blue regions are periods when Annual cycle was weak. As you see, Annual cycle was strong since 1997 up to 2002 (S&P 500 index was analyzed).
What have we done here? This standard math procedure reveals a presence of one year wave in our financial data. Wavelet is a wave visible for a restricted time. This is how it looks (Morlet wavelet):
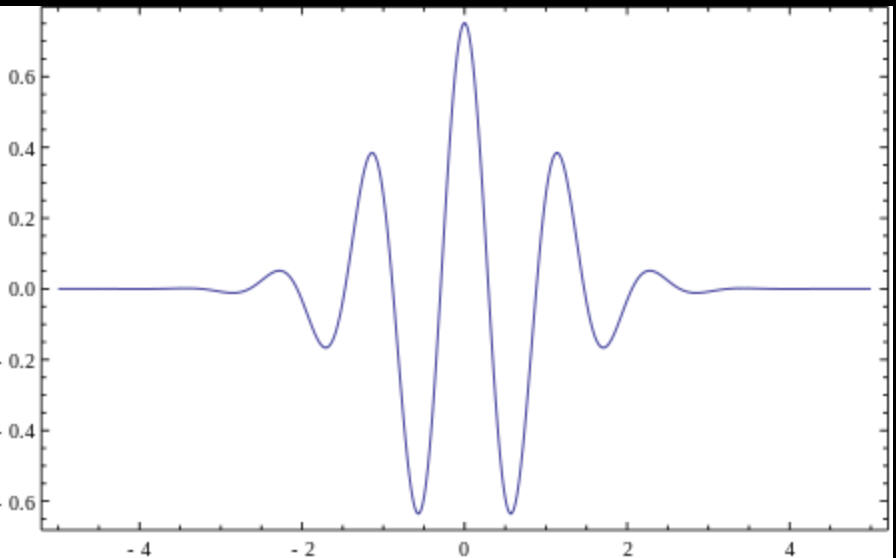
I will try to explain the general idea of wavelet analysis applied to our needs: the program tries to overlay this wavelet with the period of one year on top of our price chart and observes how this wavelet fits the price chart. For some periods, the wavelet fits well, and we mark these periods as red regions. Sometimes it does not fit, and we have blue regions. We can call this procedure as a curve fitting procedure, because we are trying to find the periods when the wavelet fits the price chart the best way.
All of that can be easily done with any standard math program. But - there is still the big question: can we build trading strategy based on this approach? The answer is no. We have done everything correctly, and this technique really reveals a presence of Annual wave in our data. However, for trading we need something else. The reason is that cycles do not appear active all the time. They exist all the time, it is true, though their presence is more visible at some times while at other periods they make look like disappeared at all. It occurs due to the cycle's interference with other cycles. We may see some cycle present in the price history (i.e. in the past), and when we apply it to our trading strategy - it may disappear. The cycles in finance data do not live forever. Therefore, instead of looking for the best curve fitting, we need to have something else, something different. Let us call it forecast-ability. It should help us to predict the future behavior of our financial instrument.
To find forecast-able cycles, we should apply a totally different math: Walk Forward Analysis (WFA). It is a different style of thinking. Moreover, there are some nuances that are usually ignored. if we try to solve this task as a classical math task. These nuances may change the whole picture in a way that a very promising model can fail being applied to real trading. So you should separate the models that explain the past price movement (curve fitting) and the models that forecast the future (forecast-ability); these are two absolutely different approaches.
Ok, let's demonstrate how the same task of finding predictable zones for Annual cycles is solved with Walk Forward Analysis procedure.
The main idea of WFA is explained in this class: http://www.timingsolution.com/Doc/level_2/WFA/index.htm
This is a fast example of how WFA works.
Today is December 4, 2017. Let's go for one year back, to December 4, 2016. At that day you make a bet with your friends that you can create a forecast for SNP500 based on Annual cycle. So, on Sunday, December 4, 2016, you calculated a projection line based on Annual cycle that goes to the next year - up to December 4, 2017. You put this projection line in some safe place, and today, on December 4, 2017, your friend takes this projection line from that safe place and draws this projection line overlaying the SNP500 chart, same as you can see here (the green line is Annual cycle, the red one - RPO(1,73,73), and the black is SNP500 price chart):
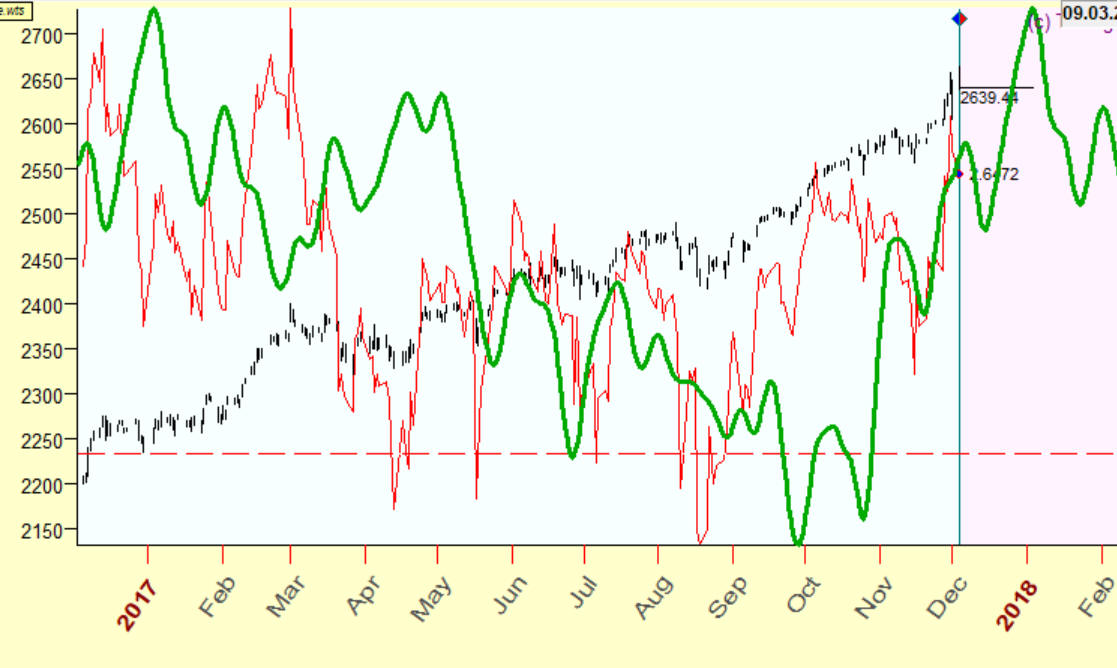
To estimate the performance of this projection line, we calculate the correlation coefficient between it and the corresponding oscillator. In this case it is 21%. As you see, this projection line catches some movements, but not all of them, of course.
To get more precise picture regarding the performance of this model, we should have similar bets in 2015 (a forecast since December 2015 till December 2016), 2014, 2013, 2112 etc. years. Let say we have them. Combining them all together, we get a result of application of Walk Forward Analysis for Annual cycle. Red bars show the periods when the forecast based on Annual cycle was good, blue - not good:
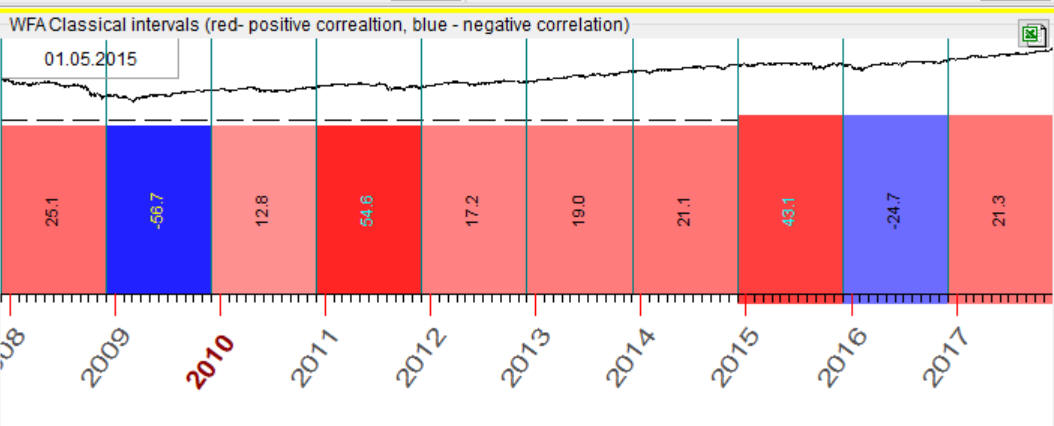
Looking at the red bar in 2017, you can see that the accuracy of the forecast is 21.3%. It is not bad.
In 2016 we have a blue bar, i.e. the correlation coefficient is NEGATIVE = -24.7%. It means that we have INVERTED Annual cycle for that year while in 2015 we got a bright red bar. It means that Annual cycle has forecasted the price quite well (the correlation coefficient is 43.1%).
Thus you can see the periods when Annual cycle forecasts price good enough or not so good. Pay attention, we speak here in terms of FORECASTING, not in terms of CURVE-FITTING. This method shows zones where, using Annual cycle, we can get some results in terms of forecast.
This is how a detailed Annual activity diagram calculated this way with WFA procedure looks:
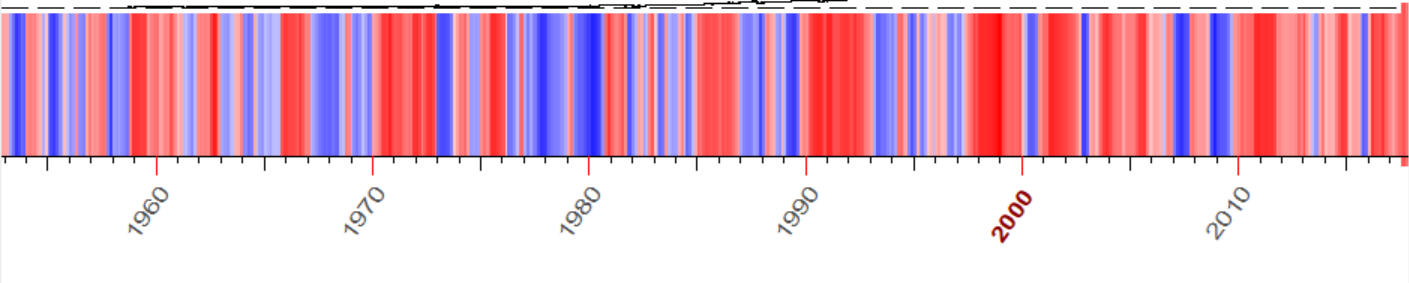
As you see, the Annual cycle activity calculated in classical style (i.e. wavelet diagram) and calculated using Walk Forward Analysis gives totally different results. Here are both these diagrams:
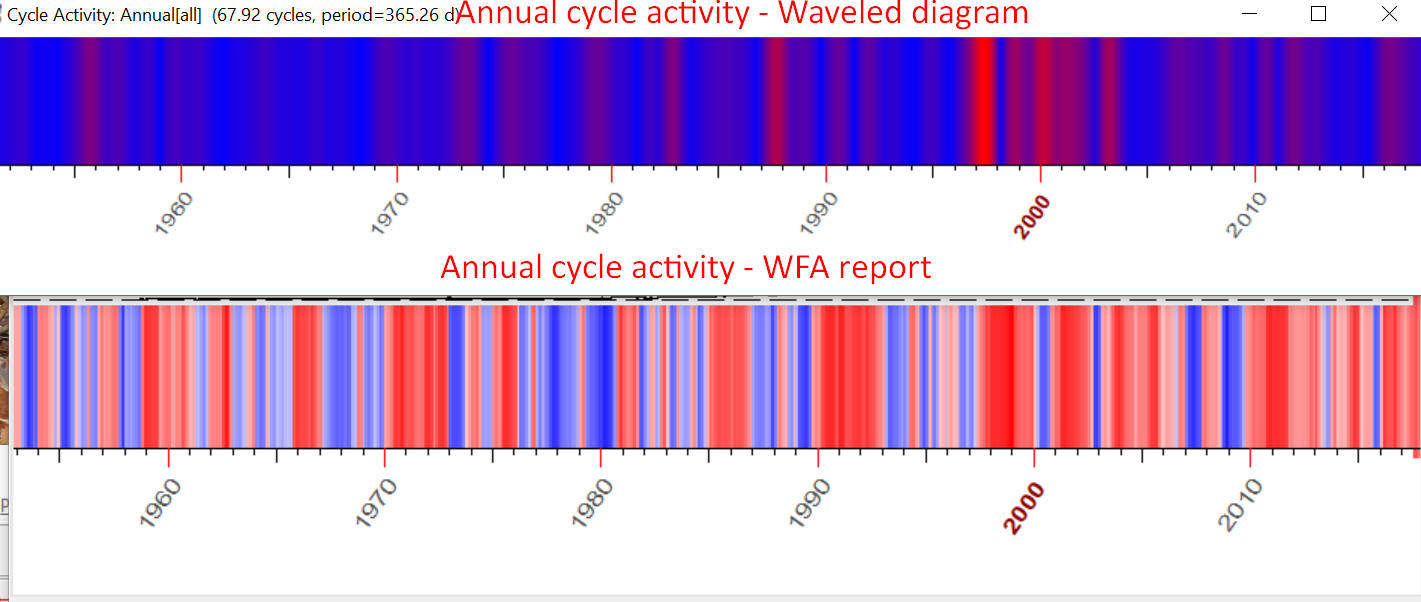
In practice it means that there is a big difference between two tasks: explaining past movements (curve-fitting) and making a forecast.
The main idea of Walk Forward Analysis is based on NON FUTURE LEAKS technology. In our particular case this technology works this way: when you bet with your friends, you put your forecast in some safe place and do not touch it, do not correct/modify/improve it within a forecasting period. This is the main feature of Timing Solution software - we are very careful regarding a verification of the projection line, the bet should be fair. From my perspective, this is another kind of programming: the verification should be based on some bet, not on curve-fitting. I keep in my head a picture like this: one person builds a projection line using the data available at the moment of the bet while another person verifies this projection line using other data received after. Both these guys control each other. It reduces the risk of an unfair bet.
Example #2 Q-Spectrum cyclical analysis for finance: Cyclical/Harmonic analysis is one of the most developed and completed branches of mathematics. Maybe it is the reason why, working with financial analysis for 20+ years, I have started to apply non future leaks technology for cyclical analysis only recently. I did not want to reinvent the wheel.
Finally in 2016 I have applied this approach in Q-Spectrum module, and immediately it was clear that we are on the right track. This module is one of the most used in Timing Solution now.
But the most important fact is that Q-Spectrum reveals INVERTED cycles. I have surprisingly recognized that applying classical cyclical analysis for finance we simply do not see, ignore half of Universe - Inverted Universe. Inverted cycles are impossible to find in terms of classical cyclical analysis. From the point of view of curve fitting approach, there are two extreme cases: 1) cycle fits (correlation=100%) and 2) cycle does not fit (correlation=0%). Classical cyclical analysis applies this approach in different variants, negative fit is impossible in this approach.
When we apply Walk Forward Analysis for finance, we have to deal with inverted cycles. This is mathematical necessity, we can not ignore this fact. This is like positive and negative values in arithmetic or electrons and positrons in nuclear physics. To see the whole picture, we should accept the inverted Universe, and in regards to the cyclical analysis this inverted Universe manifests itself if we apply non-future leaks technology only.
You can read more about this approach here: http://www.timingsolution.com/TS/Articles/anti_information/
The interesting fact is: ten years ago I faced with inverted cycles doing backtesting of the models, and at that moment I considered them as mathematical nonsense and simply ignored them. Now they are back...
December 4, 2017
Toronto, Canada