Dow Jones Long term forecast in context of 200 years of its history
Executive summary
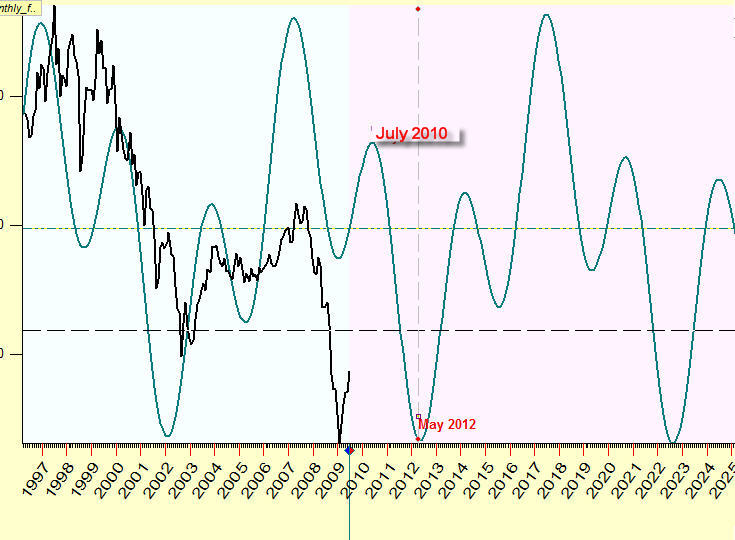
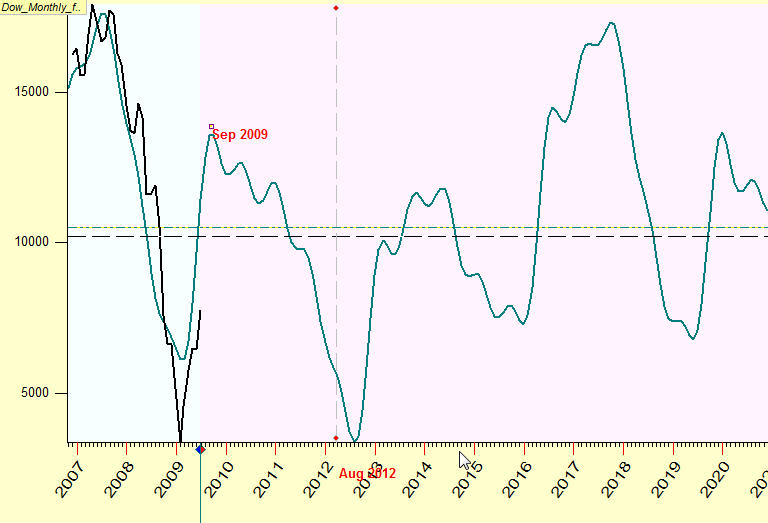
This is forecast for monthly Dow Jones Industrial based on two basic economical
cycles - Juglar and Kitchen cycles:
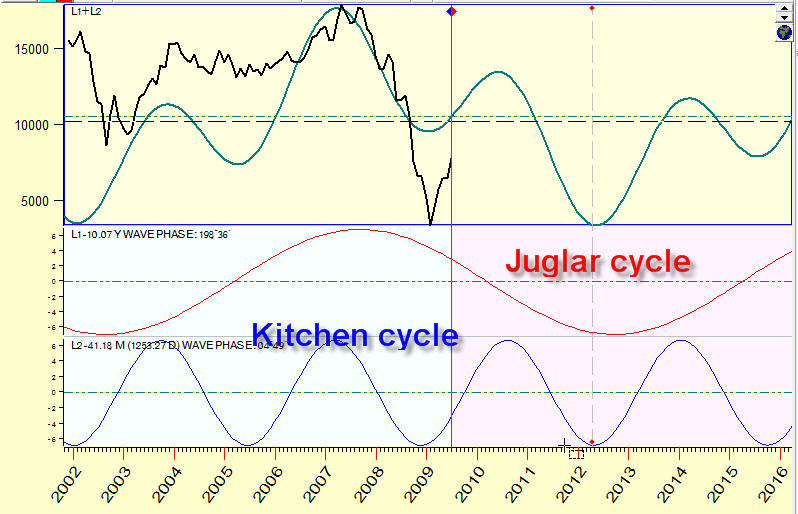
Here you can see current Juglar and Kitchen cycles separately. The current
situation (Summer 2009) can be considered as a superposition of down phase of
Juglar cycle and upward phase of Kitchen cycle:
This is a more detailed projection line that considers more overtones for each
cycle:
However the more detailed projection line inevitable contains more chaotic movements,
we should remember that.
Timing Solution users can download the worksheet for this model (unpack this
file into c:\TimingSolution\Work\ directory) here.
Details
I did the forecast based on long term Dow in the year 2004: http://www.timingsolution.com/TS/Forecast/200y/dj_200y.htm
Here it is:
In reality the 2007 correction took place half year
later than shown by this forecast; and it is much more deeper. This correction is
called now Crisis 2007-2009 (I hope).
What these five years teach me:
1) Forecasting is a very dangerous game. As one
Russian economist said (in regards to crude oil forecasts) "stock market
forecasting is dangerous for your reputation:)". Though it is very interesting
...
2) Simple models work better. To make the forecast for this article I used two basic economical cycles,
Juglar and Kitchen cycles only. I could easily apply not these two but dozen
other cycles. I did not do that because I am not sure that these dozen cycles
work in reality. In other words I prefer to use the cycles that I trust.
Constructing forecasting models you should always remember GIGO principle
("Garbage in, garbage out").
3) Even economical cycles should be considered as
dynamic cycles. In other words there is no any cycle that works forever.
The economical cycles have their own life. the amplitude, phase as well as the period
of these cycles is constantly changing. So instead of inventing more and more new cycles I prefer to research in details the cycles that
were investigated within last 150 years.
Cycle's life
For me the most intriguing of these two is Juglar cycle. It is presented practically in
any
financial data. It varies between 9-11 years. It is close to the Sun spot activity
cycle. However it is definitely not the Sun spot activity cycle.
I tend to consider the Juglar cycle as GENERATION cycle. New
generation brings new ideas; sometimes these ideas lead to bubbles, and the stock market
crushes. We cannot help it, this is the life.
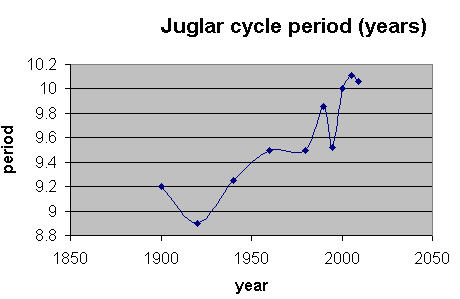
Why generation cycle? The period of Juglar cycles
is constantly increasing and I think it is caused by increasing of human
lifetime. This is the table for period of Juglar cycle for different periods of
history from 1900 till 2009 years:
| Year |
Juglar
cycle period (years) |
Kitchen
cycle period (month) |
New
cycle |
| 1900 |
9.2 |
40.11 |
|
| 1920 |
8.9 |
41.07 |
|
| 1940 |
9.25 |
40.9 |
|
| 1960 |
9.5 |
38.91 |
|
| 1980 |
9.5 |
41.71 |
|
| 1990 |
9.86 |
42.43 |
|
| 1995 |
9.52 |
43.05 |
|
| 2000 |
10 |
38.36 |
|
| 2005 |
10.11 |
41.25 |
11.86 |
| 2009 |
10.06 |
41.17 |
11.77 |
This is the diagram for table above:
The period of inventory Kitchen cycles varies in
38 months - 43 months diapason. I do not see any tendency to change for this
cycle. I only see that this cycle exists. May be it correlates somehow with 4
years Presidential cycle (kind of the stock market's reaction to some political
changes).
The 8 months difference in the period of Kitchen (40 months) and Presidential (48
months) cycles makes some kind of dissonance between these cycles.
Besides that, for the last decade one more cycle close to
Juglar becomes more active; its period is 11.8 years. I do not know what is
the nature of this cycle. Right now it is even stronger than Juglar cycle.
This is the forecast based on this new cycle:
Now I will show how these cycles work, the character
of these cycles. The standard approach to do this is to analyze these
cycles together with their overtones (Fourier analysis).
Here the pure Juglar cycle is without overtones, i.e. sinus
curve:
See how the diagram changes when we add eight overtones
to the same Juglar cycle;
these overtones allow to see the movements within this cycle:
You see there a steep decline in this curve (marked
zones on the diagram above). In other words, according to this cycle, there are
"crash" zones when the Dow drastically loses its value.
I tend to consider this cycle as GENERATION + CRASH
cycle. The new generation traders, economists, politicians are coming, they
bring new ideas, stock market corrects these ideas and makes a room for new
ideas. And the life goes on.
The Kitchen cycle looks more harmonically.