Neural Network Backtesting (EOD data)
You need to know these definitions:
LBC (Learning border cursor)
Walk Forward Analysis (WFA)
Walk Forward Efficiency (WFE)
Sample Size (SZ)
Forecast Horizon (FH)
Training and Testing intervals
Correlation
they are explained here:
http://www.timingsolution.com/Doc/level_2/WFA/index.htm
The best way to estimate the forecast ability of your models is to conduct backtesting of these models. Backtesting in Neural Network (NN) module allows to conduct Walk Forward Analysis (WFA) of models.
To conduct backtesting of your NN model, you need to do this:
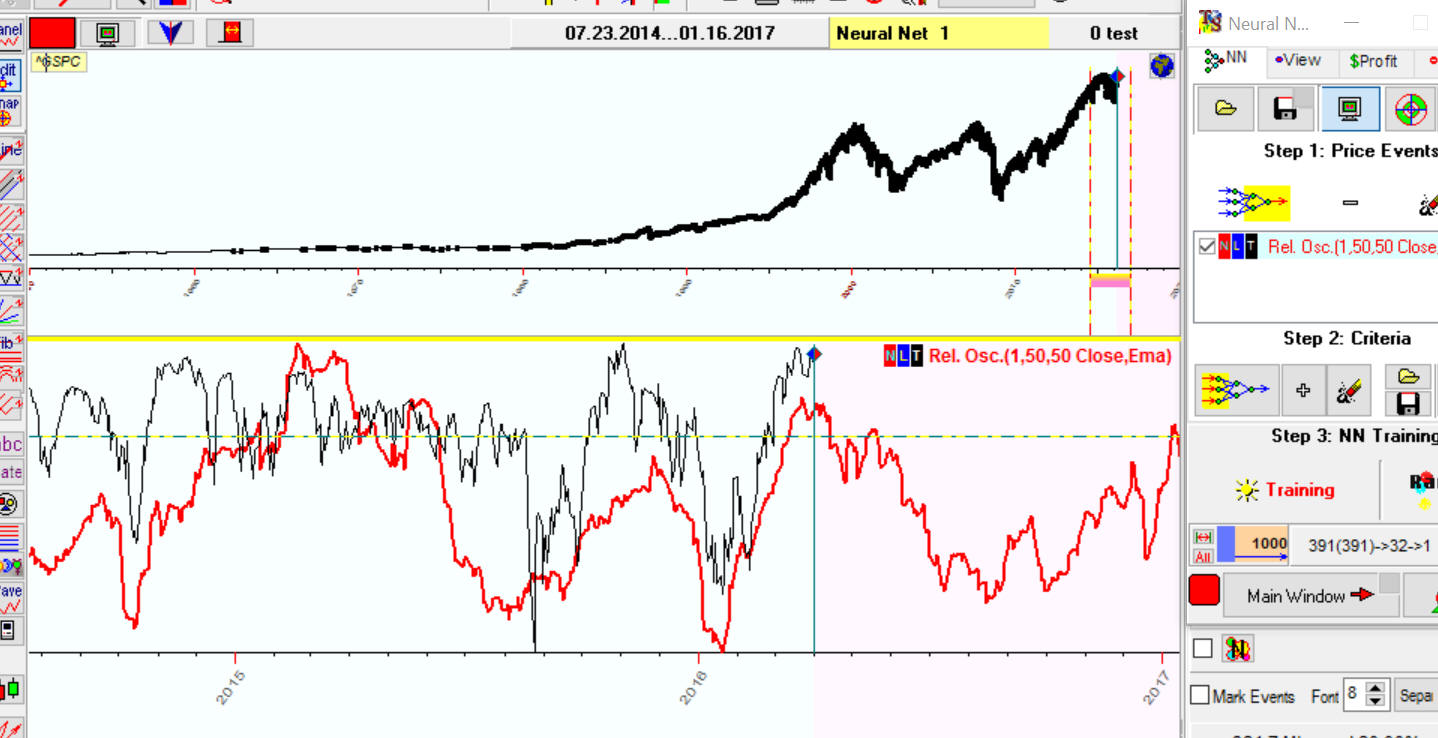
1) NN Model Create NN model a regular way. Let it be a dynamic NN model. I have created a model for you and calculated a projection line based on this model. Here it is:
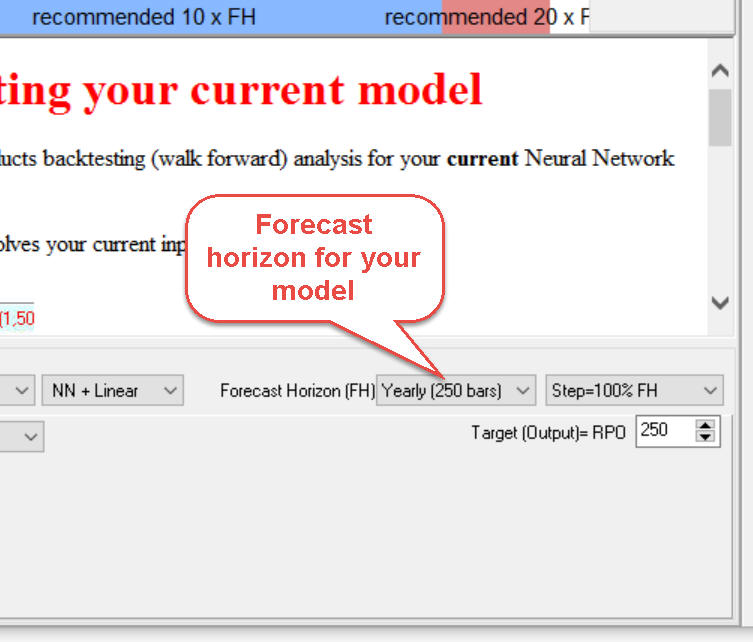
2) Forecast Horizon (FH) You have to specify the forecast horizon for your model. For example, if the model is based on Annual cycle, its forecast horizon is 365 days (or 250 trading days for EOD data). A forecast horizon of Moon phases model is 29.5 years (or 20 trading days, but better use 25 trading days due to statistical reasons).
I use this rule to specify a forecast horizon:
- for astronomical models that involve the Sun but not the Moon => forecast horizon is 250 bars (for EOD data);
- for astronomical models that involve the Moon => forecast horizon is 25 bars (for EOD data);
- for cyclical models use as a forecast horizon the period of the most important or the longest cycle.
Following this rule the forecast horizon for our dynamic model is one year.
3) Enough price history You can use this formula:
to conduct WFA you need to have = 30 x forecast horizon price history at least
For example, to conduct WFA for a dynamic model with the forecast horizon of one year you need to have 30 years of price history at least.
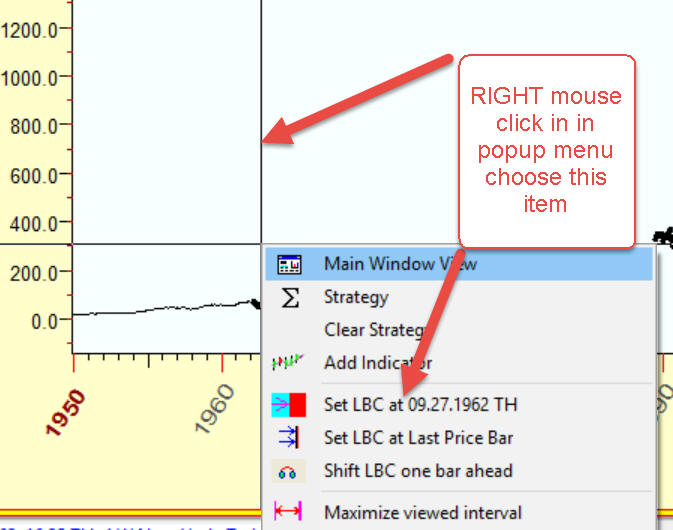
4) Dividing the price history in two intervals: training and testing intervals We use Learning Bored Cursor (LBC) to divide the price history in two intervals: training price history prior LBC and testing after LBC. You can easily set LBC with the right mouse click and choosing this item in the pop-up menu:
Before running the backtesting procedure, you should set LBC position appropriately:
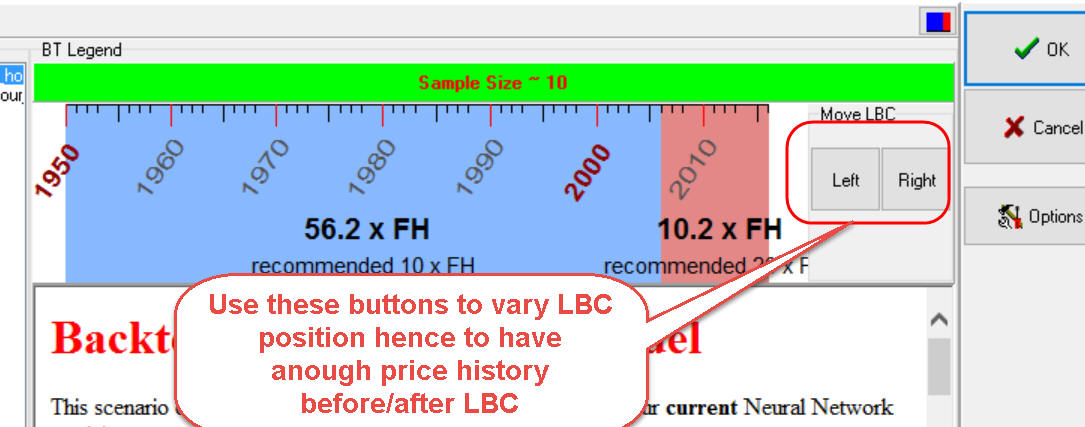
before LBC you need to have 10 x forecast horizon price history at least
and
after LBC you need to have 20 x forecast horizon price history at least
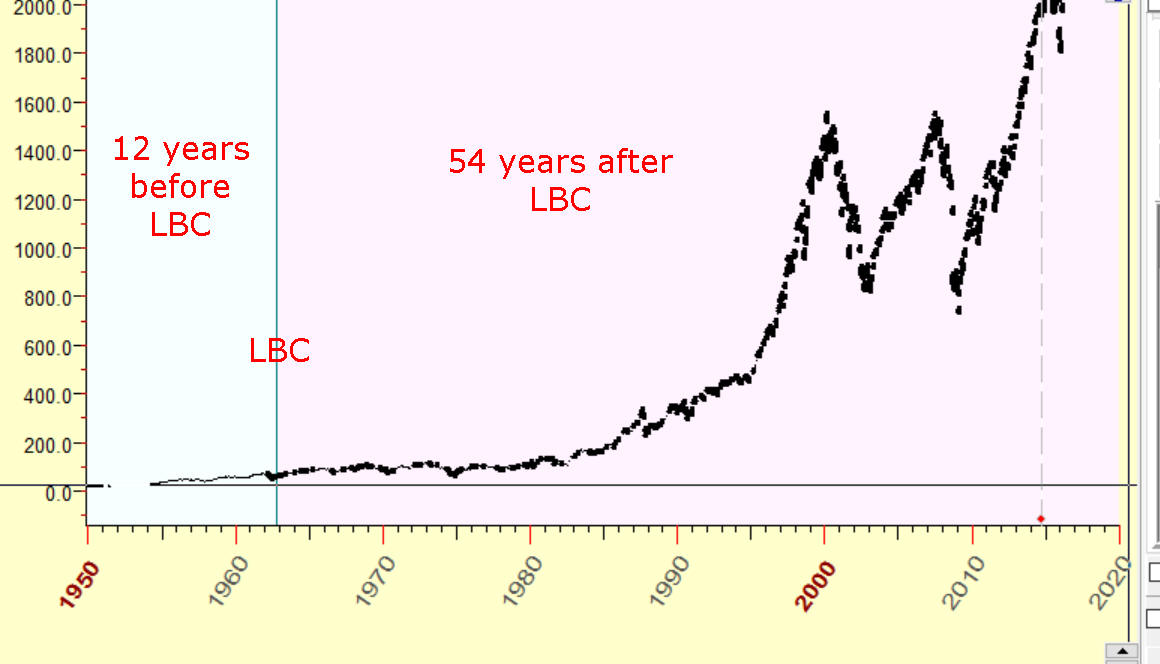
Example: below is a correct setup for our dynamic model with the forecast horizon of one year. The downloaded price history covers a period since 1950, we set LBC to 1962; thus we have 12 years before LBC and 54 years after LBC:
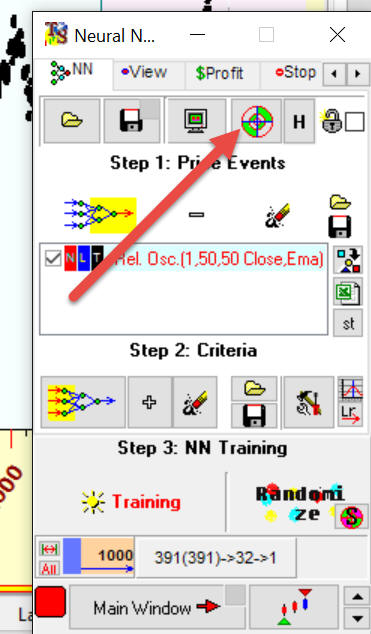
5) Backtesting itself Now we are ready for backteting. In NN module click this button:
In the left panel you should choose one of the suggested backtesting scenarios. We provide two backtesting scenarios:
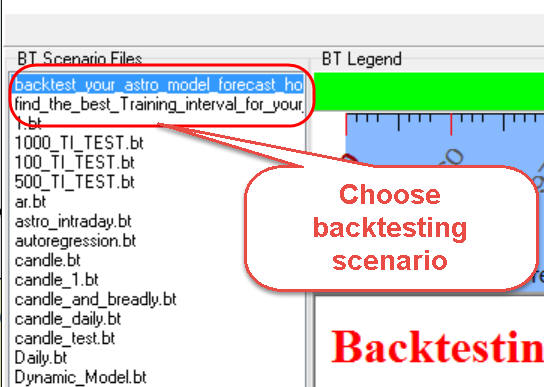
The first scenario provides WFA for your current NN model. For example, I've downloaded a dynamic astro model and set training interval to 1500 bars; i.e. to build the projection line, NN uses last 1500 bars (training interval=6 years for EOD data) of the price history, and we will explore how this NN model has performed in terms of WFA.
Another scenario allows to optimize a training interval for your NN. For example, we would like to know how many years of price history we should have to get the best projection line: 750 bars (3 years for EOD), 1000 bars (4 years), 2000 bars (8 years) etc.? This scenario helps to answer this question.
Next step, you have to specify a forecast horizon for this model:
Now you should divide the whole downloaded price history in two intervals: blue - training, red - testing. LBC - the border between these intervals. Use these buttons to shift LBC position:
Clicking "Left" button I have shifted LBC position and finally got this:
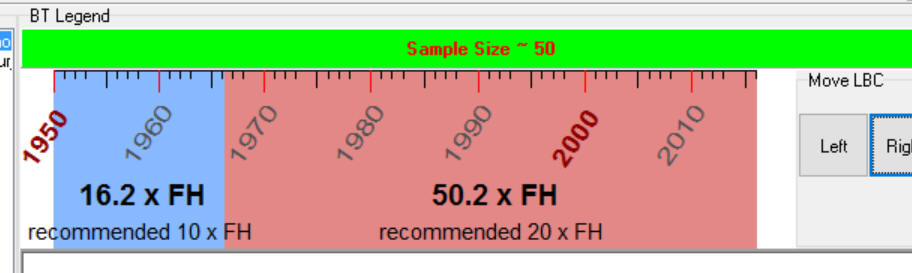
We have 16 years (16 Forecast horizons) before LBC and 50 years (50 FH) after LBC. So the rule #4 is fulfilled.
Now click OK and wait while the program performs the backtesting procedure.
6) Reading WFA results. Firstly we recommend to save the backtesting results into
a
file clicking  button. Thus you can open this file any time
later and analyze it. To view backtesting results, run BT results viewer
following this menu: "Back Testing"->"Neural Network: Backtesting Results
Viewer".
button. Thus you can open this file any time
later and analyze it. To view backtesting results, run BT results viewer
following this menu: "Back Testing"->"Neural Network: Backtesting Results
Viewer".
This is how WFA results look:
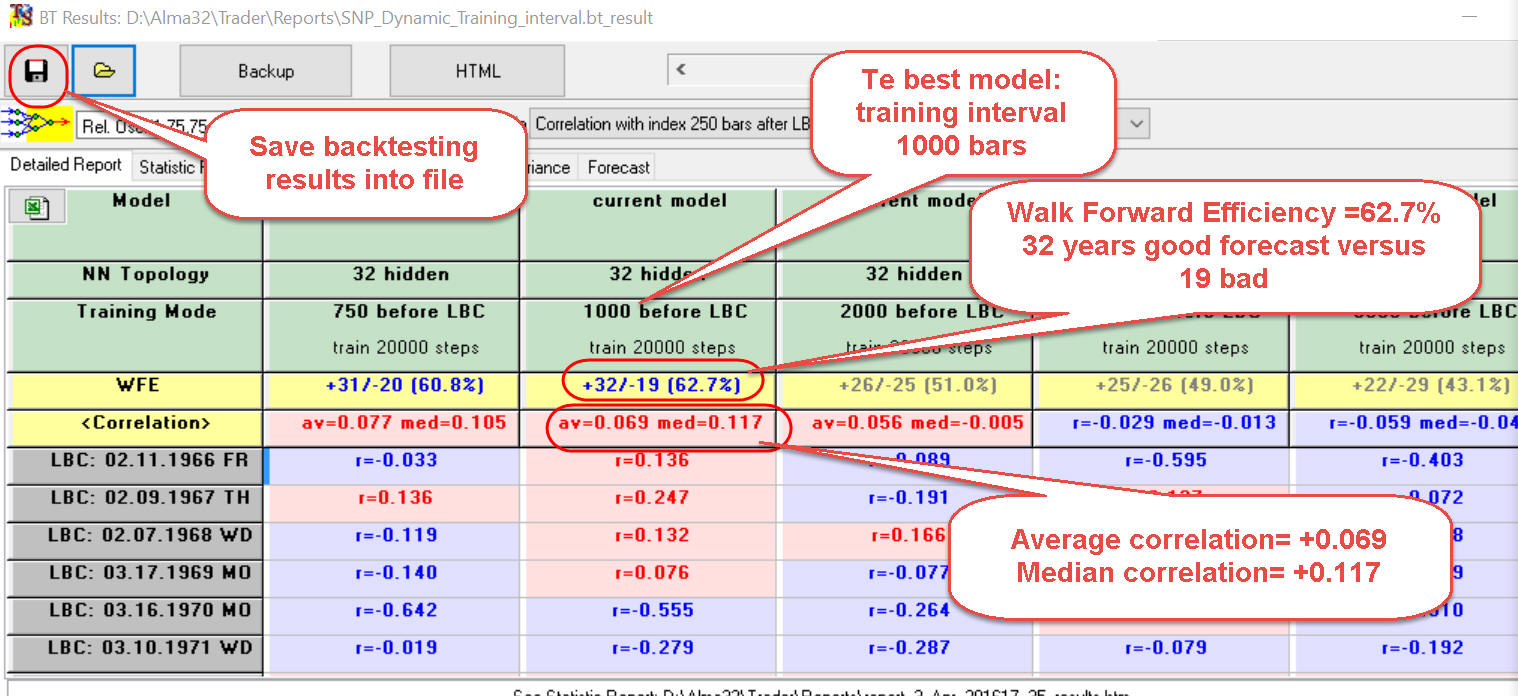
The first parameter you have to pay attention to is WFE - Walk Forward Efficiency.
Look at the second column (training interval = 1000 bars) with the highest WFE +32/-19 (62.7%).
It means that in the process of the evaluation LBC position varied 51 times, in this particular case we made a forecast 51 times. It works this way:
set LBC to  , train the NN and make a forecast for one year
ahead (since Feb 11, 1966 till Feb 9, 1967). You get this correlation
, train the NN and make a forecast for one year
ahead (since Feb 11, 1966 till Feb 9, 1967). You get this correlation
 between the price and the projection line; it is positive
hence the projection line forecasts good enough for 1966-1967 interval
between the price and the projection line; it is positive
hence the projection line forecasts good enough for 1966-1967 interval
set LBC to  , train NN and watch how the projection line works
since Feb 9,1967 till Feb 7, 1967
, train NN and watch how the projection line works
since Feb 9,1967 till Feb 7, 1967
etc. for all 51 years.
In total, for 32 years NN has provided a good forecast (positive correlation) versus 19 bad forecasts (negative correlation). WFE is 62.7%, which means the percentage of good forecasted years (for this particular forecast horizon).
You can also watch the average and median correlation for the analyzed model, these parameters should be positive.
For a good model, WFE should be higher than 50% and average and median correlation should be positive.
7) Unknowable - Clustering analysis. We recommend to analyze backtesting reports in more detail. Sometimes you can find there the cases like this:
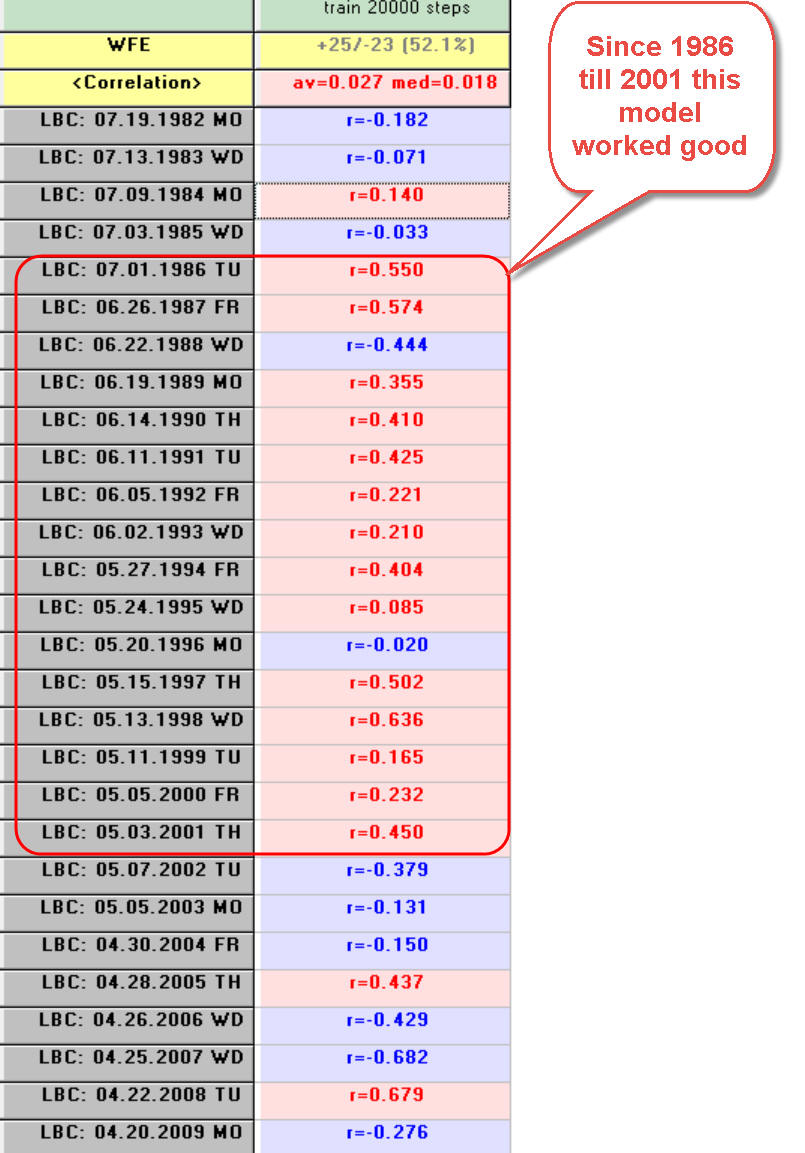
As you see, since 1986 till 2001 this model worked well and after that it stopped working. We don't quite understand the nature of this phenomenon. Maybe this model really works this way: sometimes it works, sometimes not.
It may be also some occasional coincidence. You have to remember about "fat tails" phenomena in finance. From the point of view of classical statistics, the probability that within 16 years the model has 2 years with a negative correlation is
1/2^11=1/2048 i.e. practically impossible...
Impossible... From the point of view of the classical statistics, it is really practically impossible, but not so in finance.