Simplest backtesting
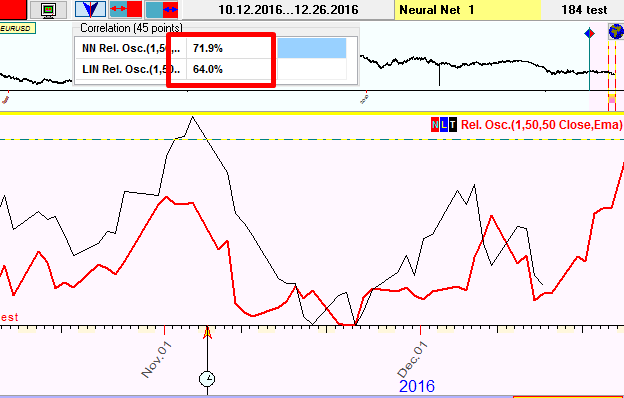
Here I would like to answer some questions asked by a user. He analyzed Neural Net projection line and got a very big correlation between the price and the projection line. Look, here the correlation reaches 71.9%:
The question is: can we trust this digit?
The answer is: no, we cannot. I recommend to read this class: http://www.timingsolution.com/TS/Articles/how_to_use_correlation/index.htm
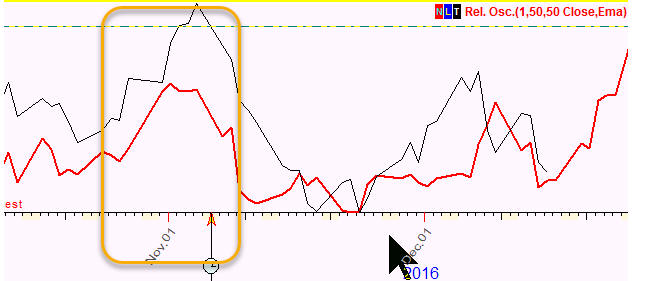
In the example above, 72% correlation is caused by the fact that this projection line has caught this marked peak, only one peak:
So I highly recommend to consider any correlation coefficient higher than 20% as a suspicious one. There is a strong possibility that some artifact is present there, a very simple occasional fact that explains this high percentage.
To get more reliable information, I recommend to consider more price history; it provides us more variety of price movements and decreases the effect of occasional factors.
So, instead of two months of the price history after LBC as in the example above, I have selected two years of the price history and got this 12% correlation:
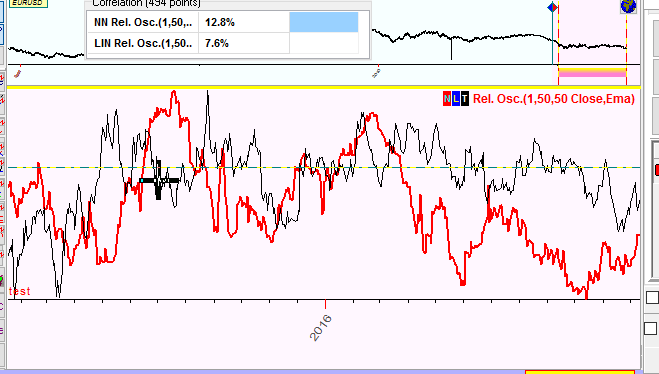
Here we can see the whole picture with good and bad news.
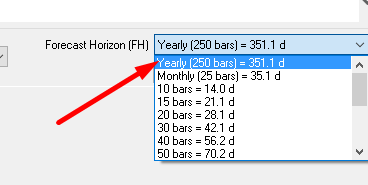
To get more reliable picture, I would recommend to conduct Walk Forward Analysis for this model. De facto it conducts the procedure explained above several times, this amount we call a sample size (SZ). The interval of two years that we used to calculate the correlation is called Forecast Horizon (FH). It should be long enough to provide a variety of data. Typically as Forecast Horizon we can use the period of the most typical cycles. For Annual cycle it would be one year, for Moon cycle - one month. In this example we can apply one year FH as well, within this interval this model still provides enough variety of data.
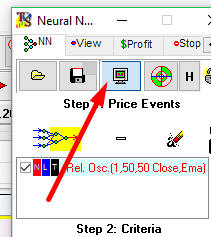
Now in Neural Network module click this button:
Firstly choose Forecast Horizon here (FH):
Click several times "Move LBC Left" button to move LBC to the left to have more price history for testing/out of sample interval. This way we increase Sample Size (SZ). Let it be 6:
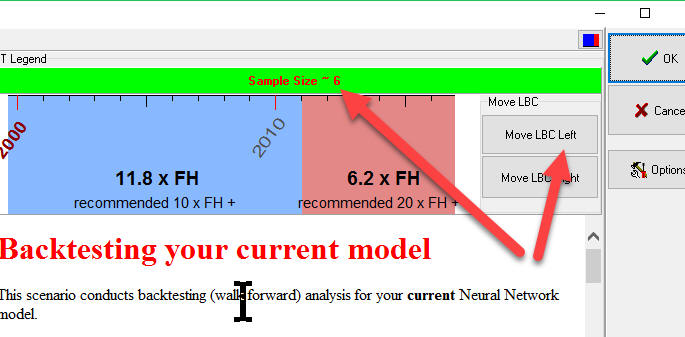
Clicking "OK" and waiting for some time, you will get Walk Forward Analysis report, like this one:
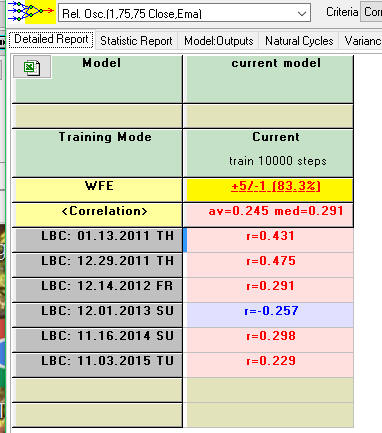
We vary here LBC position setting it to  ; then we train
Neural Net and watch how the projection line works on 250 bars (i.e. one year)
after LBC position. We got 0.43 i.e. 43%
; then we train
Neural Net and watch how the projection line works on 250 bars (i.e. one year)
after LBC position. We got 0.43 i.e. 43%
Then we shift LBC once again and calculate the correlation for another period equal to one year. We repeat that several times.
Totally we have four positive correlations and one negative (the inverted projection line).
Average correlation for this model is 0.245 i.e. 24.5%