Chi Square Criterion
The question from TS user:
We see here all phases of the aspect's life (it begins-culminates-ends).
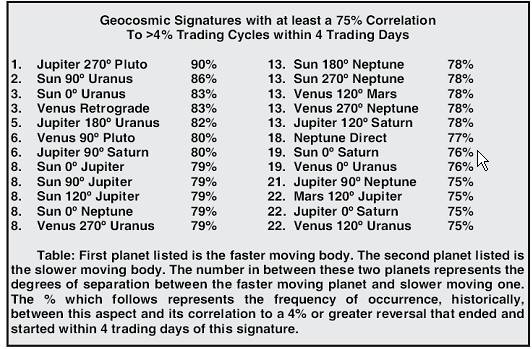
This Table is by Raymond Merriman from an article he wrote
for Trader�s World Magazine # 31 2001 on page 24
How can this be done with Timing Solution?
The answer:
Before doing anything, we need to understand clearly what kind of statistical criteria should be
applied in this particular case. Definitely, it is not Pearson correlation
criterion.
Correlation criteria are applied when we compare two time series data sets - like
the correlation between historical volatility data set and tidal force data.
However for financial market data it is better to apply another criteria. I believe the best is
the usage of chi
square statistical criterion. While working with this criterion, we need to
cover many small though very important things.
Let's start ...
Sample size. The first question you
should ask is: "What is the sample size is?" or "How often does this
aspect take place?". Your sample size should be big enough to get
significant statistical results.
For example, somebody says that he has found the aspect that
forecasts the next week's direction with the accuracy 75%. Ask him this question:
how often does this aspect take place? If the answer is "4 times", simply
recommend this person to flip the coin 4 times and see what happens. We do not need complicated statistical
books in this case, just use your common sense, nothing else. 4 times is not
enough for any conclusion.
I guess Raymond Merriman did his research using Dow data, which is more than
100 years of price history. There are slow aspects in his Table; as an example,
take Jupiter - Saturn. Its period
is almost 20 years. I tend not considering Jupiter aspects, the random mistake
is too high here. Faster aspects are OK in this regard.
Control group. This is the most important
and tricky question in statistics. I would say that Raymond Merriman has provided his research correctly
in this regard - because he says this:

However, you need to understand correctly why 4%. The classical approach to
calculate reversals is by calculating Filtered Zigzag indicator. This is how 4%
zigzag looks for Dow:
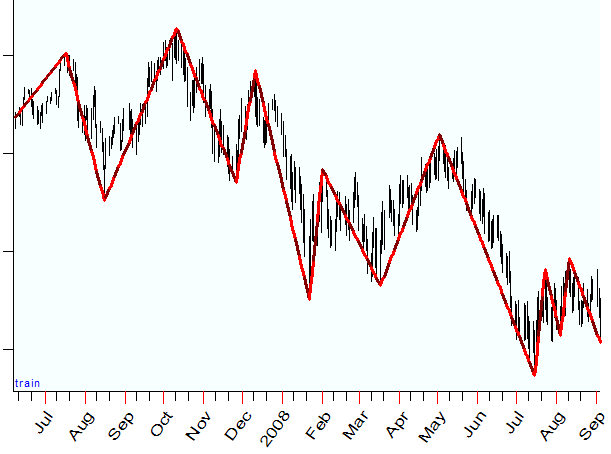
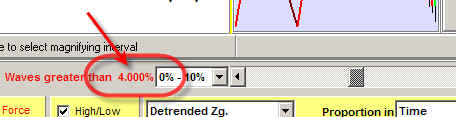
The question is how often these reversals take place. Here is the answer (our
program provides it):
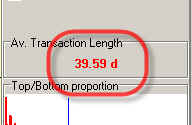
The average distance between reversals is almost 40 days. Raymond Merriman
says about the time span "within 4 days of this signature"; in other words,
it covers 8 days interval (4 days before and after) while 4% reversal happens at
least once in any 40
days. So, the signature he mentions deserves your attention, it is OK, and you
can continue this research.
But- if somebody says about "within 20 days of this signature", the
time span in consideration is 40 days. The reversals still take place within 40
days; it means that the reversals happen no matter what signature with 40 days
time span is analyzed. In statistics, it is called "the artifact".
However, in our
case everything is OK.
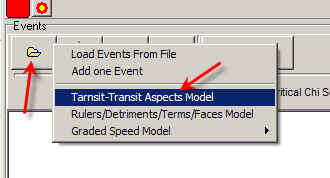
Technique. How can this research be done
with our program? In Timing Solution
Advance, run "Turning Points Astro Indicator" (I analyze Dow 1885-2008
yy):
and set these parameters there:
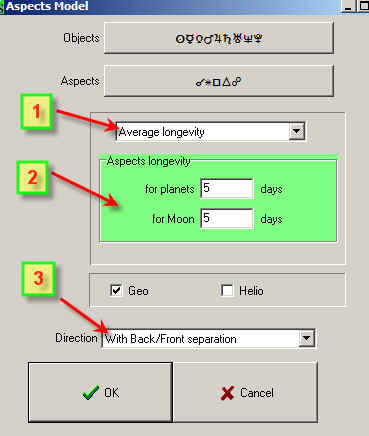
1) set the orb for these aspects to keep the same average longevity of these
aspects (it should be wider for fast moving planets while for slow planets
it will be smaller);
2) set average longevity as 5 calendar days (it is 4 trading days for daily data);
3) separate Back and Front aspects (like Jupiter-270-Pluto and Jupiter
square Pluto).
Define the zigzag clicking here:
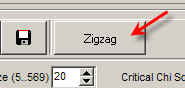
Set it to 4%:
The statistical parameters should be set this way:

You can decrease the sample size, say setting it to 10 to take into account
more seldom occurring aspects, however the result will be much less reliable.
Click "Calculate" button.
Chi Square - analyzing the results. You
should receive this result of calculations:
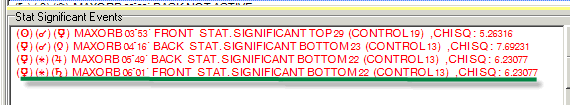
The last string says to us that Mercury's sextile to Saturn (Front aspect)
looks like a significant one.
We analyzed all these aspects during this 119-years period, and this aspect took
place more than 100 times. 22 times this aspect (with orb=6 degrees) has
coincided
with reversal points. The control group show us that if this aspect would not
have any
impact on the stock market, it should coincide with the turning points only 13 times. In
other words, when this aspect took place the stock market reversed his trend more
often (22 times) than the control group shows (13 times). Remember that
this aspect took place more than 100 times, and in 22 cases some turning point occurred.
In other words, turning points took place in 22% of these aspects, while control
groups shows 13% only. If this aspect would not work, it would coincide with the
turning points only in 13% of cases.
Chi square criterion show the degree of the difference between the real coincidence
and the control group.
Summary:
22 - the analyzed aspect coincides with reversals 22 times;
13 - the coincidence within the control group.
Chi Square=(22-13)*(22-13)/13=9*9/13=81/13=6.2
The bigger chi square the more statistically significant event we have.
Actually for research like this I recommend to use this technique http://www.timingsolution.com/TS/Mini/9/index.htm