The Sun-Moon (Solar-Lunar) cycles for daily and intraday data
The Sun and the Moon cycles are the most important cycles for us, the Earth's inhabitants.
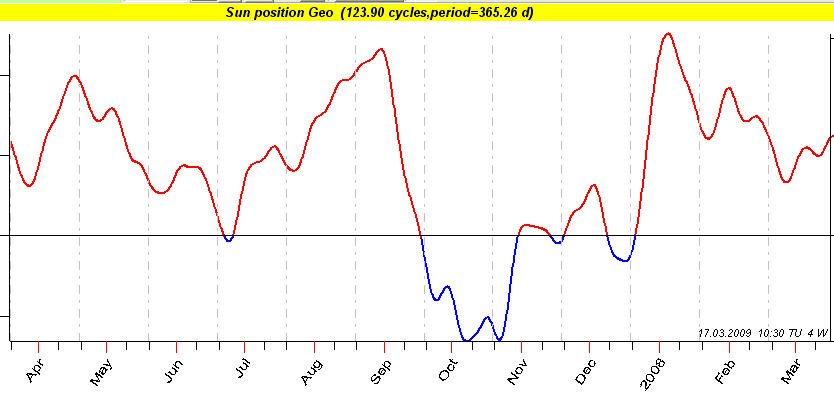
Speaking about daily data, the Sun cycle simply represents Annual (Seasonal) cycle. The cycle of the Moon phases is also important (i.e. the cycle described by the angle between the Moon and the Sun).
On practice the Annual cycle adjusted to Dow Jones Industrial Index from 1885 year till 2009 year looks this way:
You should understand that this is the "average" picture that reflects the most common tendencies for last 120 years of DJIA history. Multiframe technology allows to break the closed cycle of "common tendencies"; read about it below in this article.
This is how the Moon phases cycle looks like:
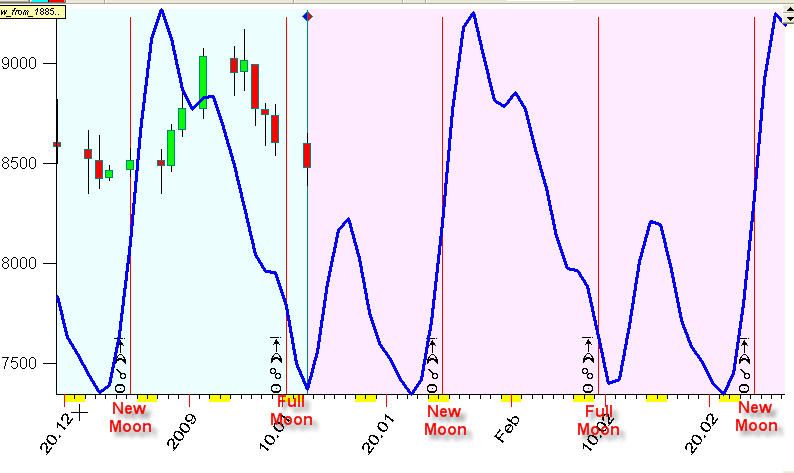
The well known effect of the Moon phase cycle is: DJIA is higher around the New Moon and lower around the Full Moon.
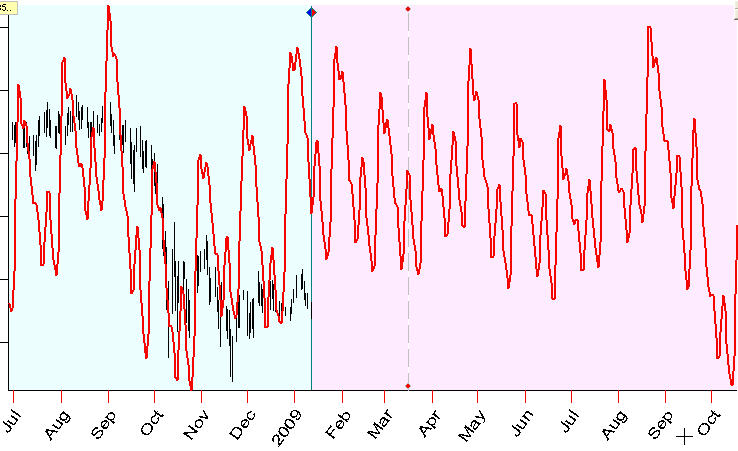
This is how the superposition of these two cycles looks like:
If we speak about intraday data, we deal with much faster cycles. The most important among them is Daily (Diurnal) cycle. Astronomically this cycle corresponds to the Sun's position regarding the horizon; astrologically it means the position of the transit Sun in transit houses; technically it corresponds to the Sun's position in In Mundo Zodiac. Thus 24-hour daily cycle is similar to one year Annual cycle; we simply use different Zodiacs there: for Daily Cycle it is In Mundo Zodiac while for Annual Cycle it is Tropical Zodiac. There is another fast cycle I recommend to pay attention to: this is the Moon's position regarding the horizon (= the Moon in houses = the Moon in In Mundo Zodiac). Due to the fast Moon movement, the period of this cycle is about 25 hours. The Sun and the Moon daily cycles form a tidal force that affects the Earth's inhabitants.
In reality Daily (Diurnal cycles) looks this way (Euro/USD hourly data):
Red is the Sun daily cycle, blue - the Moon daily cycle.
Look at the superposition of these two cycles:
It reminds me the diagram for tidal force, here it is:
This is a math effect of pulsation that appears when we form the superposition of two cycles with close periods (Sun daily cycle - 24 hours period and for Moon daily cycle - 25 hours period).
Now I will demonstrate how to calculate the Sun-Moon cycles for your financial instrument with Timing Solution software.
When you download the daily price history, you can calculate easily the Annual cycle. Run the "Astronomy" module:
Usually the program uses all available price history to calculate the Annual cycle. For example, you have downloaded 20 years of price history. All this price history (before LBC) will be used to calculate this Annual cycle. However, you may have some insight that the Annual cycle for the last 10 years works differently than it has worked 20 years ago; thus you need only last 10 years of price history to calculate this cycle. In this case apply multiframe technology; in "Options" set stock memory=10:
Click "Ok" to see how the projection line changes. Here to calculate Annual cycle we use a period equal to 10 full Sun cycles, i.e. 10 years. Try to vary this parameter setting it to 3, 5, 7.
This idea is a base of committee technique http://www.timingsolution.com/TS/Mini/12/index.htm , we research there the same cycle with different time frames.
More about Annual cycle is here: http://www.timingsolution.com/TS/Uphistory/upgrade_19.doc
Let us go back to the Sun-Moon cycle. Click this button to put this cycle (Sun cycle=Annual cycle) into Composite box:
Now define the Moon cycle (Moon phases) and put it into Composite box as well:
We have now two most important cycles in the Composite box. The program immediately displays the Composite Box - a superposition of these two cycles - in the Main Screen:
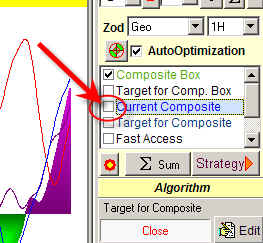
I recommend to uncheck this option to make visible the Composite Box only:
Try to create this model using different values for stock memory parameter. For your convenience I did that already (created models with different stock memory).
Now you can open them clicking this button:
You will find these models:
The first model, Daily_Sun_Moon_Model.cmss, uses all available price history to calculate the projection line.
The second model, Daily_Sun_Moon_Model_SM=7.cmss, uses 7 cycles to calculate the projection line.
Next models use 15 and 30 cycles.
Working with intraday data, we will use In Mundo Zodiac.
When you download intraday data, you can calculate Daily (Diurnal) cycle setting these parameters in Astronomy module:
Now if you plan to calculate the Sun-Moon cycle, put the cycle above
(Diurnal) into Composite Box ( )
and create the Moon cycle:
)
and create the Moon cycle:
Put this cycle into the Composite Box as well, and you can see Sun-Moon intraday cycle in the Main Screen.
You can use ready models for intraday Sun-Moon cycles:
As for daily models, the first model Intraday_Sun_Moon_Model.cmss uses all available price history to calculate the projection line.
The second model Intraday_Sun_Moon_Model_SM=7.cmss uses 7 cycles to calculate the projection line, etc.
Below is the table where I put all cycles discussed in this article:
| Cycle | Parameter in "Astronomy" module | Period |
| Annual cycle |  |
1 year |
| Moon's Phase |  |
~28 days |
| Sun's Daily (Diurnal) cycle |  |
24 hours |
| Moon's Daily (Diurnal) cycle |  |
~25 days |