Target: what to forecast
Timing Solution allows to forecast different indicators. It means that though you download the price history, you can make a forecast not for the price only. Option traders are more interested in forecasting volatility, and you can make a forecast for volatility or for true rang (the difference between high and low). Some users are more interested in forecasting ADX index (average directional movement) to figure out the trend's continuation perspective. It is possible to do all these things with Timing Solution. You can do it through "Target".
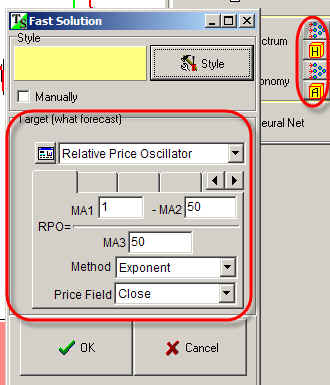
Suppose you plan to work with some of the fast solutions (see the "Fast Solution" module).. Before running it, look attentively at this dialog box:
I recommend you to research options available in "Target" menu. These are different things that the program will forecast. By default the program forecasts the relative price oscillator with parameters shown above. The relative price oscillator is designed to eliminate a trend in analyzed data (more about relative price oscillators see here: http://www.timingsolution.com/TS/FAQ/rpo.doc ).
Check out all options available there:
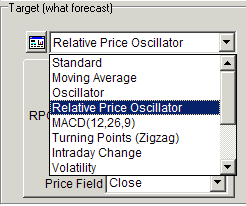
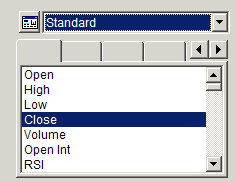
For example, if the trend is not so significant in your research, you can analyze Close itself without detrending:
To make a forecast for true rang (High-Low), use this item:
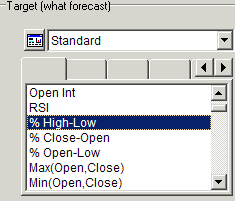
We calculate true range as a percentage.
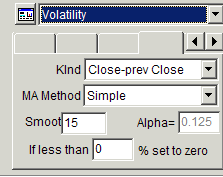
Volatility:
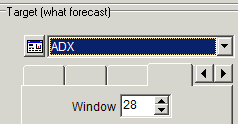
ADX:
and many other indicators.
Now I will show how this feature works in different modules.
Spectrum: models based on fixed cycles
You can create a forecast mode based on fixed cycles for ADX index (the technology is described here: http://www.timingsolution.com/TS/Study/E/4.htm and http://www.timingsolution.com/TS/Study/E/class_spectr_2.htm )
Follow these steps in Spectrum module:
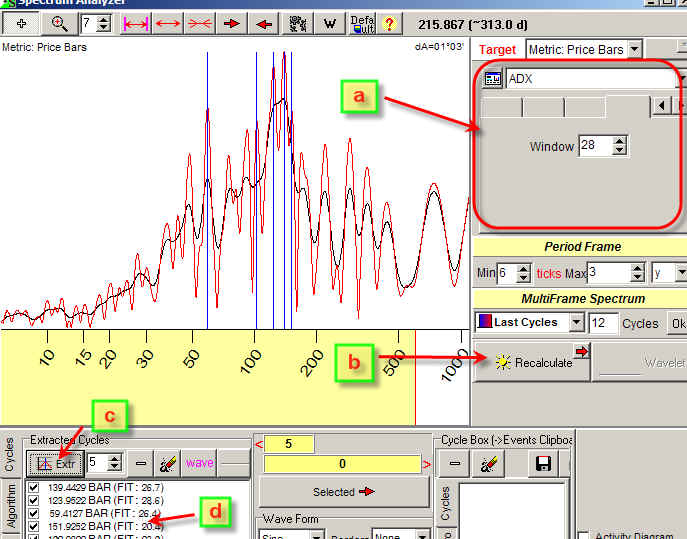
a) set ADX index as a target;
b) click "Calculate" to calculate spectrum for ADX;
c) click ![]() to
extract five (as an example) dominant cycles;
to
extract five (as an example) dominant cycles;
d) drag these cycles into Main Screen to get the projection line based on these cycles.
There is one recommendation regarding the usage of spectrum module. Sometimes we have a biggest peak on weekly (7 days) cycle:
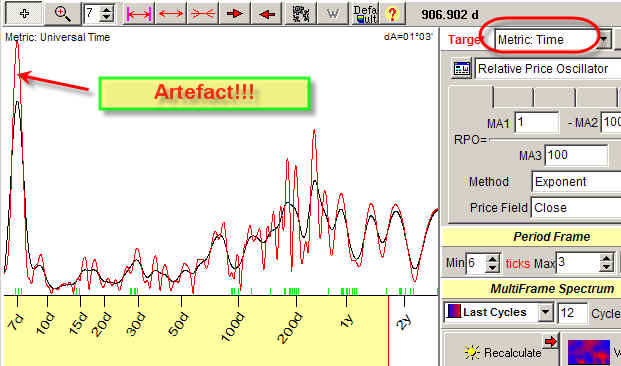
Be cautious with this weekly cycle. In most cases this is just the artifact caused by non trade weekends (for daily data).
I recommend to increase the minimum period of calculated cycles, it is here:
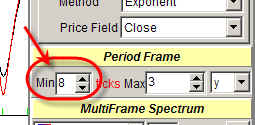
O better set "Price Bar" metric to calculate the period of cycles in trading days:
Turbo Cycles module (Advanced version)
To set the target for Turbo Cycles module, click these buttons:
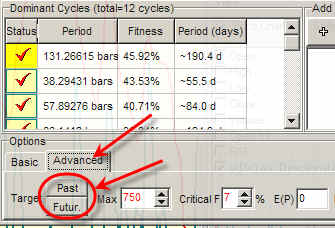
I recommend to set the target clicking both buttons "Past" and "Future".
This feature allows to extract dominant cycles for one indicator ("Past" button) and generate a projection line using another indicator ("Future"). For beginners, I recommend to set the same indicators for "Past" and "Future".
Neural Network module
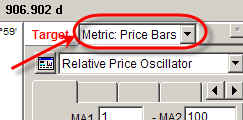
You can define a target here:
In Neural Network technology it is called output. Pay attention that in Neural Net models you can define several indicators to be forecasted at the same time (as on the picture above).
Composite (Astronomy) module
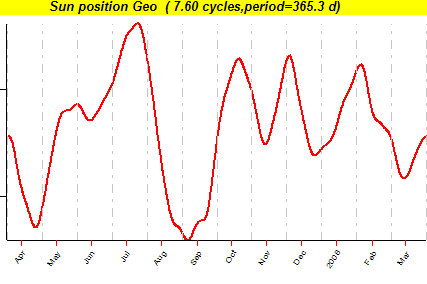
If you need to reveal astronomical cycles for any indicator say ADX, click this button:
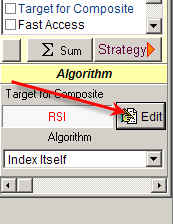
As an example, see the Annual cycle for ADX index:
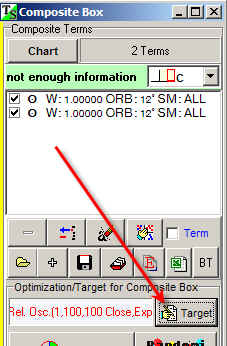
Also when you create the model based on several astro cycles using "Composite Box" module, you can set the forecast target right in "Composite Terms" window:
This technology is described here: http://www.timingsolution.com/TS/Study/Class_Comp/class_comp_prelim.htm