Lesson 12
Spectrum - some recommendations to create Spectrum model
In this article I would like to share with you some useful ideas and methods of creating the forecast based on fixed cycles. The models that provide this type of forecast in Timing Solution are called "Spectrum models". There the projection line is created in two stages:
Spectrum module finds the most efficient cycles for some financial instrument;
Neural Network or ULE module generates a projection line based on those cycles found in step 1.
If you like to try Spectrum models for your practice, I highly recommend to start with reading these classes (if you have not read it yet):
http://www.timingsolution.com/TS/Study/Classes/class_spectr_1.htm
and for intraday data
http://www.timingsolution.com/TS/Study/Classes/class_spectr_2.htm
Thus, instead of repeating the basics of Spectrum module, I concentrate now on the application of this approach to some real financial instrument. If you think about creating these models for intraday data, please read also this class:
So everything below is shown for S&P500 daily data. You can easily apply this technology for any other financial instrument. Whatever financial instrument you choose, these are the steps you have to do while creating the forecast. Once again, I will not discuss here the main idea of this approach or any small detail; see it in classes above. For each step, I will show what I usually do.
1) Data: how many data do you need? For daily data I use 4-10 years of price history. The usage of bigger price history does not change the situation, it only takes more time for calculations.
2) Forecast horizon. This method provides forecast 2-4 weeks ahead.
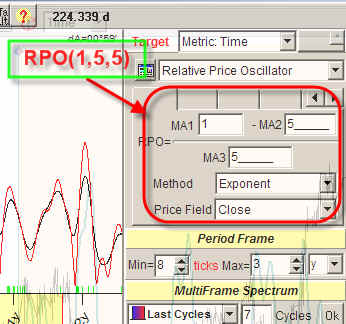
3) Pay attention to short term cycles. When you run the Spectrum module, it is better to adjust it by revealing the short term cycles. It seems to me that the best way to do that is using the short term relative price oscillator as a target for Spectrum module.
I use the oscillator with 5 bar period:
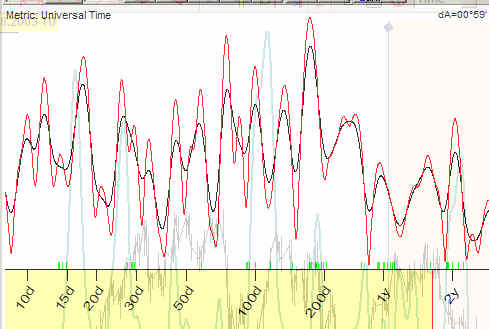
See the Spectrogram with this oscillator:
Now try as a target the oscillator with 50 bars period. See the difference:
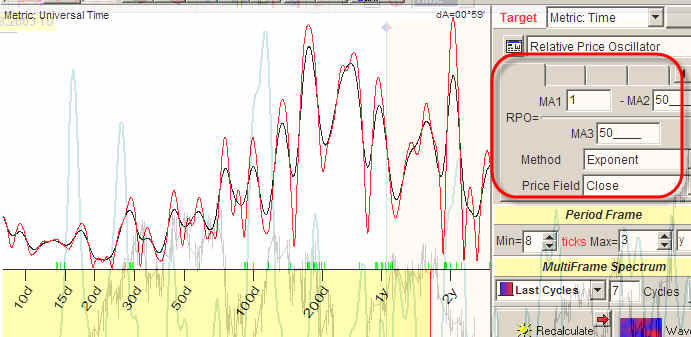
The short term cycles are not so visible here as they are in the previous diagram. Thus to emphasize the short term cycles we use short term oscillator as a target for spectrogram. We may try as well the supershort oscillator RPO(1,2,2).
4) Stock market memory. This thing is available under multiframe spectrum option:
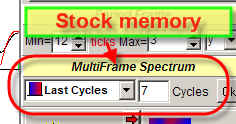
One parameter here is called "stock market memory": 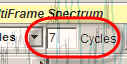
I have found that for most financial instruments this parameter should be between 5 and 10. I use here 7.
5) Better avoid the weekly cycle. I did not get any results while using weekly cycles. I set the length of minimum cycles to 12 bars:
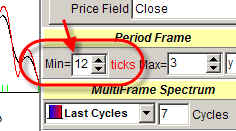
With this setting, a weekly cycle is skipped. It is very interesting that usually we can see the 7 days weekly cycle on spectrum diagrams, though its application for modeling the price movement does not provide any remarkable results. It might be that the usage of shorter cycles opens the door to Chaos.
6) How many cycles to extract? Now when the Spectrum diagram is calculated, you can extract the strongest cycles from this diagram by clicking on this button. The strongest cycles correspond to the highest peaks on this diagram:
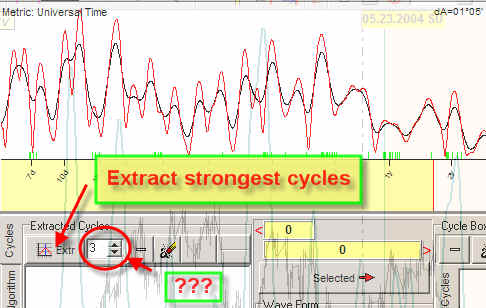
Here the question arises: how many major cycles is it better to extract? The experience shows that 2-4 cycles is enough. Do not use too many cycles. You will not get improved results, only a confusion.
7) Amount of Overtones. The last parameter you need to set is the amount of overtones used for cooking a projection line with revealed cycles. I use these parameters:
Sometimes I use only 1 overtone. Do not use many overtones as it is a door for Chaos. Keep it locked!
8) Getting the forecast. This is a really simple step: just drag your cycles to the Main window, and you will see the projection line immediately:
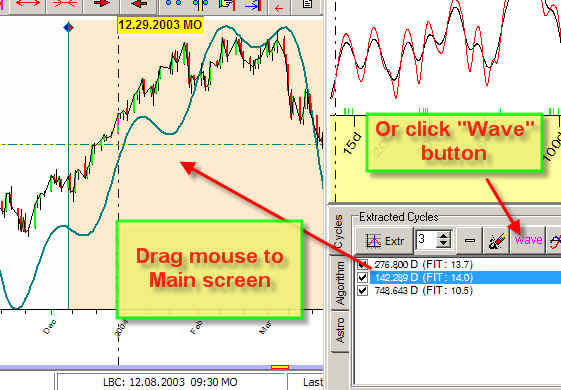
The same result may be achieved by clicking "Wave" button.
9) Final recommendation. Keep your mind cold as the ice and clear as the crystal. You may be confused by the general appearance of your projection line - it might be not ideal or beautiful or it might be simply a bad one. Usually some users in this situation add more overtones, apply more cycles, etc. Sometimes they get a better looking projection line - though for just one particular case. This picture disappeared when LBC is moved or new data added. What can I say? Before claiming your projection line as "the one", move LBC several times and repeat the whole procedure for different LBC positions (i.e., calculate Spectrum, extract cycles, generate the projection line). And remember that sometimes you may not find a good enough projection line at all. Accept this, - and try again later, with new data.
The last recommendation. There is an option in Timing Solution that sets LBC in a random way:
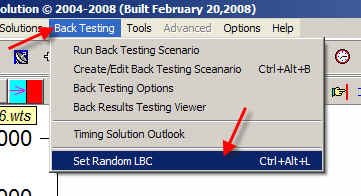
I use this option a lot for checking my models.
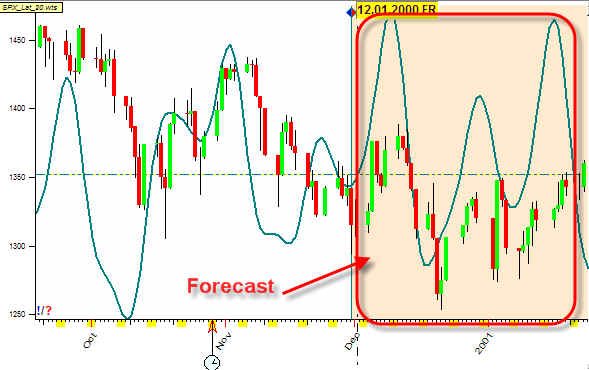
Below I put several projection lines calculated for different Learning Border Cursor (LBC) positions:
February 21, 2008
Toronto, Ontario
Sergey Tarasov