Revised edition March 15, 2005
Spectrum model with wavelet ASTRONOMICAL cycles (recommended)
Models Spectrum based on Spectrum Committee (for advanced users)
This is a step by step guide for different types of Spectrum models. You can read it through or you can go right to the description of the model you may be working with (in this case, follow the hyperlink above). In general, for any model, you need to reveal the cycles that have impact on your market and then create a projection line based on those cycles. Therefore, we provide very technical descriptions for any type of models, trying to cover all important issues regarding each model. If you have any questions, please contact us.
Let us reveal the most influential cycles for some stock and then create the Neural Net projection line based on these cycles.
In Timing Solution, it is really simple to do. Run the Spectrum module and click on this button:
There are several very important parameters in Spectrum module that has impact on the quality of the projection line. The default values for these parameters are based on Back Testing; the results of this work are presented in "Naked Truth" section on this website. Here are these parameters:
You can change them and click ![]() button once again.
button once again.
Now run the Neural Net module. As a target (outputs), we will use the oscillator with 50 days period:
As we create a model based on fixed cycles, we can use these cycles as inputs for the Neural Net. We take them from the clipboard:
Also you can perform these operations using fast access button:
Now we are ready to train Neural Network to obtain the projection line based on extracted fixed cycles. But before doing that, you should set up one very important parameter - the length of the training interval. You can take this parameter as the length of stock market memory regarding fixed cycles.
It looks like the best way to reveal the optimal length of the training interval is applying the Chaos Theory features. Click this button:
You will get this window:
Drag the mouse cursor to the maximum of the yellow diagram. In the left top corner, you will see the corresponding period of this "stochastic" cycle.
To do that, click this small button:
The same window is available through the "Train" tab:
Now you can set the length of the training interval:
Then click on "Training". The process of the Neural Net training starts, and soon you will get the projection line based on the revealed cycles.
Click "Stop" after 10,000 steps of training and click  button to put this projection line into Main Window. To remove the Neural Net
Panel, push this button:
button to put this projection line into Main Window. To remove the Neural Net
Panel, push this button:
Now you can see our projection line:
You can do the same procedure easier, using this Fast Solutions button:
2) Spectrum model based on manually chosen cycles
In the previous example, clicking ![]() button, you have extracted all important
cycles (as the program sees them), put these cycles into the clipboard and then
created the forecast based on these cycles. The weakest point of this approach is
- the program itself decides what cycles are important and what are not
that important. However, you may have a different opinion regarding the cycle's importance. Timing Solution Spectrum module allows you to choose the most influential
cycles manually. To do this, click on "+" button and then click the mouse
button somewhere around the peaks of Spectrum diagram:
button, you have extracted all important
cycles (as the program sees them), put these cycles into the clipboard and then
created the forecast based on these cycles. The weakest point of this approach is
- the program itself decides what cycles are important and what are not
that important. However, you may have a different opinion regarding the cycle's importance. Timing Solution Spectrum module allows you to choose the most influential
cycles manually. To do this, click on "+" button and then click the mouse
button somewhere around the peaks of Spectrum diagram:
The program will calculate the nearest cycle that corresponds to the chosen peak and put it into the list. You can perform this procedure many times picking up the most important cycles:
As a good tool to see how any particular cycle works, you can create the wave for any cycle. Click this button:
Look at the Main window:
You also can choose several cycles to create several waves at the same time:
Here they are:
This is a very good tool to play with cycles trying to understand how they affect the stock market.
Now we are ready to make the projection line based on chosen cycles. Put all these cycles into the clipboard (clicking on this button):
Then you can use them in the Neural Net module as the inputs to get your projection line. Just repeat the steps you have done in the previous chapter.
In these examples, we have selected manually the cycles around the maximums of Spectrum histogram. Actually, you can use any cycle. For example, you would like to explore 75 days cycle (you may have learn from somebody that this cycle has some meaning for your market). Though this cycle is not a maximum of the Spectrum diagram, you can work with it:
I would like to make some recommendations regarding how to choose the cycles.
Recommendation A: The peak on the Spectrum diagram should be high and narrow. The narrower is the peak, the more certain you are that this cycle component is presented in the stock market data.
Recommendation B: In Timing Solution, there is the ability to calculate the Spectrum diagram using two independent intervals. If you do that, check "Do Split" option:
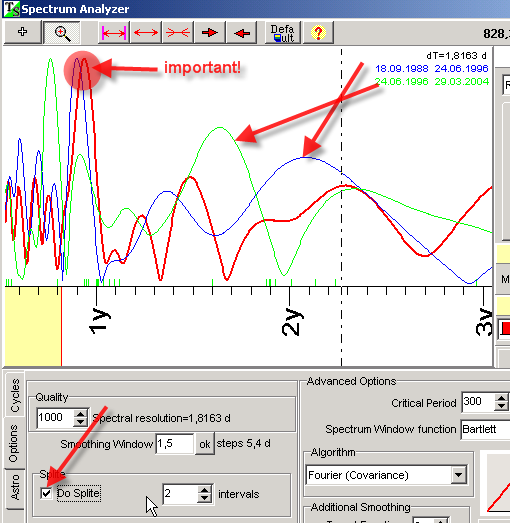
In the example above, the red curve represents the Spectrum calculated on all available price bars (1988-2004). Blue represents the Spectrum calculated on the first interval (1988-1996 years), green - on the second interval (1996-2004). The most influential cycles are confirmed by all diagrams (like in this example).
3) Spectrum model with wavelet cycles - second dimension
In previous examples, we were dealing mostly with a linear approach. It means that the compound impact of all revealed cycles on the market is a mere sum of each individual impact. Thus, what we do is just revealing the most influential cycles and prolonging them into the future. But the reality is much more complicated - the cycles do not affect the stock market in the same way all the time. Sometimes the same cycles affect the stock market a lot, while at another periods these cycles are not active at all. It makes sense to take into account the cycle's activity and periods when it is presented. The wavelet analysis allows to reveal such periods. Moreover, we can provide the analysis for these time zones and use this information while creating a forecast. More information regarding this issue is here: http://www.timingsolution.com/index.php?module=subjects&func=viewpage&pageid=10
As an example, let us extract cycles and provide the wavelet analysis for these cycles.
Run the Spectrum module and click on this button: ![]() .
.
We'll get the list of the most powerful cycles for the market. Let analyze them one by one.
Highlight the first cycle:
If the program does not display the wavelet diagram check this option:
To reveal the cycles for its wavelet diagram, click on this button:
We will get the spectrum for the wavelet diagram:
This diagram represents the spectrum of cycle's activity for 58.1 days cycle. For example, one of the peaks is situated around 3 years (approximately). It means that our 58.1 days cycle mostly impacts the market with a 3-year periodicity. In other words, every 3 years there is a strong possibility that such a cycle (58.1 day) is playing an important role for the chosen market. We can find out any other important cycles of activity for this 58.1 days cycle. In other words, we can understand how 58.1 days cycle reveals itself in time. we do it through these wavelet cycles (we call them as w cycles).
Let us extract the most powerful cycles from this diagram. We can do it clicking the mouse around any peak:
In this example, we have extracted 6 powerful wavelet cycles (w cycles):
Now, we can do the same for the next (96.1) cycle at the initial Spectrum window; picking it up from the list:
If we have enough information already, we can stop this process. Otherwise, we should continue and extract wavelet cycles for other longer cycles (141 days, 162 days, etc.). We recommend to provide this analysis for the first 2-3 fastest cycles (in our example, these are 58.1, 96.1 and may be 141.8 days cycles). The fastest cycles provide the most important information for the trader regarding short term price swings. This is why we recommend to provide more detailed analysis for the fastest cycles.
The program automatically puts all these cycles into the clipboard, and we can create the Neural Net projection line following the same steps as in the previous example.
A few words for advanced users regarding w cycles: To model these cycles, we use the special math approach. Modeling usual cycles, we used to apply sin and cosine waves; modeling w cycles, we use regular wavelets. This approach gives better results in revealing nonlinear effects caused by the interaction of different cycles.
This option
indicates how many overtones we use to model w cycles.
4) Spectrum model with wavelet ASTRONOMICAL cycles (recommended)
In this example, we try to take into account some external factors for the Spectrum model. To extract astronomical cycles from the wavelet diagram, click on this button:
This module allows to extract the astronomical cycles:
Usually, it is necessary to use several wavelet diagrams to extract astronomical cycles. As in the previous example, we recommend to provide this analysis for 2-3 fastest cycles. In this example, the first two cycles were analyzed (58 and 96 days):
Now, in our "Cycle Box", we have fixed cycles:
and astronomical cycles:
The program automatically puts all these cycles into the clipboard, so we can create the Neural Net projection line following the steps as in the previous example.
5) Creating models that catch turning points better
In the previous examples, we were dealing with some relative price oscillator. This oscillator fits very well if we would like to research the timing for future price movements. If you are more interested in making a forecast for turning points, the detrended zigzag may fit better. The detailed information regarding the detrended zigzag is here: http://www.timingsolution.com/TS/Uphistory/u_5.htm
Look at this picture. Here you can see the relative price oscillator (period=25 bars) - a blue curve and 5% detrended zigzag - a red curve at the same chart:
You can see that the detrended zigzag reflects the turning points better than the oscillator. The relative price oscillator is more oriented to reflecting the price movements, while the detrended zigzag "sees" the turning points only. Anything going between two subsequent turning points is not interesting for the detrended zigzag.
If you decide to work with the detrended zigzag, use it as the target in the Spectrum module and the Neural Net module as well.
In the Spectrum module, you should set it here:
After that the Spectrum will find the cycles for the detrended zigzag.
For the Neural Net, the detrended zigzag should be set this way:
Clicking on the "Try" button, you will get the window where you can adjust the parameters of our zigzag:
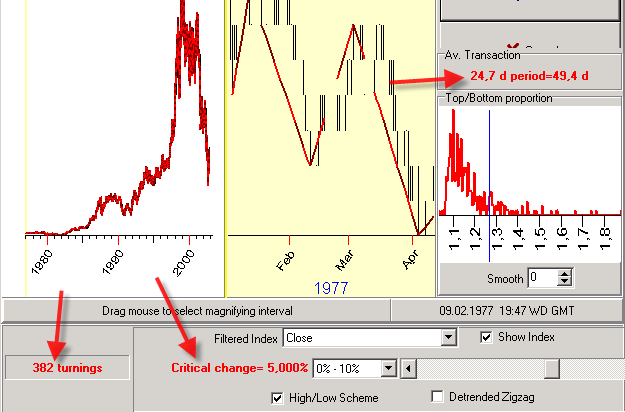
In this example, the setting of the critical change for the zigzag at 5% gives us 382 turning points; the average distance between two subsequent turning points is 24.7 days. It means that this zigzag generates an average 49.5 days wave.
I have found that the Neural Net is very selectable to detrended zigzags - it likes some zigzags while there are some that it does not like. I tried to make Neural Net projection lines for 2%, 5% and 7% zigzags. It gives the best projection line for 5% zigzag.
In any case, the zigzag used to calculate the Spectrum and the zigzag used for the Neural Net should be based on the same critical change.
The projection line generated by the Neural Net for the detrended zigzag has a "triangle"-like structure which is very convenient for the identification of turning points:
6) Multiframe versus Standard Spectrum
Calculating the Spectrum for all examples above, we applied the multiframe algorithm:
This algorithm is very good in revealing short term cycles. You can read about it here: http://www.timingsolution.com/TS/Study/EasyCycles/forecast_in.htm
The standard spectrum is more oriented to revealing permanent cycles in the stock market movements:
It makes sense to play with both possibilities.
But in some cases the usage of multiframe is preferable. Look at this example: let's consider the Spectrum that uses all available price bars for 7 years price history (Eur/Usd - 1998-2005 yy). Here it is:
The short cycles area is very noisy, and this is unavoidable because the stock market is moved by too many different forces; in the long perspective, this mosaic looks chaotic. The irregular diagram in the short term cycles region simply reflects this fact. For example, if we consider 7 days cycle in the perspective of 7 years, this cycle will perform 365 revolves during this period. This cycle will be visible on a spectrum diagram only in one case - when it is able to keep its "nature" during all these 365 cycles. In other words, it should keep the phase (like its Monday price movements now should be similar to Monday price 7 years ago), it should keep its period of 7 days, not 8 days. In reality, the picture is much more complicated, especially regarding the cycles phase. I recommend to use the wavelet diagrams that make "cycles nature" visible.
When we consider the 7 days cycle in the short term perspective (like 70 days), the picture is much more stable. This is what the multiframe spectrum is for. It uses only last price history data to calculate short term cycles. This drastically diminishes the noisy effect:
This spectrum looks a lot better.
7) Models Spectrum based on Spectrum Committee (for advanced users)
upgrade Sep. 23, 2005
This model allows to catch non linear effects in models based on fixed cycles. If we assume that stock market is moved by some interacting cycles in some non-obvious/nonlinear manner, we should not expect getting a good spectrum diagram with high narrow peaks - because the spectrum diagram reveals only permanent cycles. The existence of nonlinear effect can make the peaks corresponding to any cycle wider, or "melted", or sometimes splitted (we have seen this while experimenting with different model examples). The best way to observe this effect is the usage of Spectrum Committee module in Timing Solution software.
Let's demonstrate how it works. Download the price history data (S&P 500 1950-2005) and run the Spectrum module. Click on this button:
You will get the Spectrum Committee panel:
What the program does is calculating the Spectrum diagram for different Learning Border Cursors:
You will get 4 Spectrum diagrams plotted in one window:
Dragging the mouse cursor, you can see the details of Spectrum diagram:
You see that all four spectrum diagrams show one of the peaks around 320-day cycle, it means that this cycle is strong enough. It presents in different time frames. We definitely should use it for the forecast.
The most interesting feature of Spectrum Committee window is that we can select different active zones to create the Neural Net projection line.
We can select these zones this way:
We can choose several active zones. Also you can push the right mouse button to choose the active zones
Now open Neural Net module and in the dialog box where you usually set events click on this button:
You will get this window:
Click on "Try" button; the program will create 100 fixed cycles with 3 overtones each. All these cycles are located in active zones that you have defined in Spectrum Committee window:
In other words, we create a bunch of fixed cycles with different periods. The Neural Network creates the model based on these cycles. Thus, we can catch nonlinear effects and changes in cycles periods. Actually, this is the first approach to one of our middle term projects, 6-12 months, to develop a special Nonlinear Spectrum that allows to reveal almost ALL possible cyclic processes in price data, linear and non linear as well.
The good news regarding this technique is that it provides the forecast. All four examples (Dow Jones, S&P 500, Nasdaq and Euro/USD) discussed above provide a positive correlation between the projection line based on cycles from active zones and the price. See here the details
upgrade Oct. 14, 2005
This is the most exciting feature of the Spectrum module. Instead of the standard Universal Time, we can use a new kind of time that is connected to planetary positions. We can consider this new time as a regular time, i.e. we can apply the typical math routines to reveal the cyclic processes in this time and make a forecast based on this time. The preliminary research definitely shows that this approach is worth to be used.
Let's begin to work with Planetary Time. Open Spectrum module and choose this option:
Now you should press these buttons (1 and 2):
The program will create the data base that is necessary for Planetary Time techniques. You need to do it just once.
Now you can define the planetary pair or one planet that will serve as a "clock hand" for our Planetary Time:
This is the planetary time defined by Mercury geocentric position. The experiment shows that the usage of the Sun Time only (that is close to Universal Time) provides the different Spectrum than for Universal Time. This affects the projection line based on such cycles drastically.
The Spectrogram based on Planetary Time looks like this:
Here we used the Sun Time. The period of strongest cycles is pointed in degrees, because the Planetary Time is measured in angles of appropriate planets. This diagram reveals the strongest cycle processes in Planetary Time flow.
We can use these cycles in a regular way:
1) Extract them, put into clipboard:
2) Use these cycles as inputs for Neural Net module:
This techniques is a brand new. There are many hidden details and nuances here. We provide the Back Testing to clarify these details. There are two possible algorithms to calculate the planetary wave in Planetary Time flow:
It looks like the "Algorithm B" provides the better results than "Algorithm A". We continue the research in this direction.
In Upgrade October, 17 it is possible to define the metric (Universal Time, Price Bar or Planetary Time) right through the "Style" window:
August 3, 2005 - March 15, 2006
� Sergey Tarassov