Overview of astro cycle based models in Timing Solution
Pro et Contra
written by Sergey Tarassov
Working with astro based cycles, I always face with a sociological phenomenon of non acceptance of astrology. This attitude has no rational explanation, it just reflects the social status of astrology. However, for medium/long term forecasts the astro based models provide very good projection lines, and it would be simply stupid to not use them.
Here I put several random projection lines based on so called "Dynamic Model". There was no selection here, just a mere fact as it is. This model is based on astronomical factors, and I did the detailed back testing of this model many times. The conclusions are:
1) This model is not ideal, it explains only some part of the stock market behavior. But - while working on the stock market forecast, any information is important.
2) This model is really able to forecast for one year (250 daily bars) ahead, it is a statistically verified fact.
3) This model is not a combination of well-known Annual cycles, some other factors are playing here.
I very often ask myself: "Does the astrology works?" Actually the Timing Solution's architecture reflects my search for the answer. With this software, we can create the astro based models as well as very complicated math based models (like spectrum analysis, auto regression and others). And we can compare these models. I love the astrology; however my scientific background requires to test all statements before putting them into models that TS users apply for their trading. I feel myself responsible for the provided information.
So, I will introduce astronomical/astrological techniques available in Timing Solution. I tried to be fair here, i.e. the examples were not selected with the purpose of making a good appearance. See yourselves...
Bradley Model
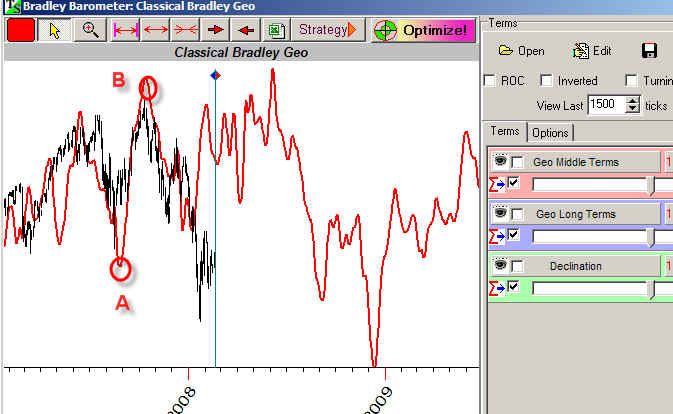
This is a model based on Ptolemy aspects applied for market forecast by Donald Bradley in 1946. This is how it looks like:
The turning points A and B projected by Bradley model are very impressive, are not they?
To get a better understanding of this model, view it in a bigger time frame:
It is obviously not ideal, and we need to work more with this model.
In Timing Solution you can adjust this model using slides on the right side. You can vary this model in a thousand ways: using different weights for aspects, playing with the orbs and Zodiacs; you may even create something like a kind of Bradley model based on middle points.
Here you will find some information regarding Bradley model http://www.timingsolution.com/TS/Study/Bradley/index.htm
I love Donald Bradley�s book "Stock Market Prediction". It looks like he was the first one to try to present astrological techniques using a language understandable not to the astrological community only. However we need to develop this
technique further. I believe he would do the same if he would be alive.
Planetary Time
It is a popular technique among TS users.
It is simple: we display the vertical lines that are equidistant in respect to some planetary position (or to the angle between two planets). The example above shows the lines that correspond to 5-degree step from some initial position of Saturn in Leo (to be exact, 5 degrees and 42 minutes). Thus, instead of time intervals, we watch planetary position related intervals. This technique is described here http://www.timingsolution.com/TS/Articles/PT/
Astronomy Module
This module allows to reveal astronomical cycles inside the financial data.
The simplest astronomical cycle is Annual cycle. It uses the Sun position only. See how this cycle looks for S&P 500:
And this is a projection line calculated for the Sun's cycle:
We can calculate more complicated cycles as well. For example, this is a composite for the Moon phases (the Moon - the Sun angle):
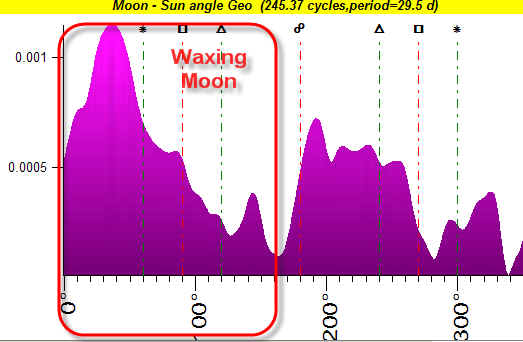
The diagram shows that in average S&P500 is higher when the angle between the Moon and the Sun is between 0 and 150 degrees (increasing light/Waxing Moon).
You can combine many different cycles creating models based on that combination of several astro cycles.
This module is described in details in Classes: http://www.timingsolution.com/TS/Study/index.htm
Universal Language of Events (ULE)
You can calculate practically any astro phenomena using this module.
As an example, see the speed difference between Mars and Venus in Declination Zodiac (a red diagram):
or Berg astro indicator:
or the Moon tidal force:
All these events as well as many and many others can be calculated there.
Moreover you can provide the statistical analysis for all these events avoiding any kind of dicing/guessing so dangerous for trader. This is a very powerful module, and I recommend to everybody to study it really well. You will be able to test in seconds any statements that may affect your trading. Try it any time when you hear about some magical aspect/astro combination/ astro hint from some advisor - you will see immediately whether it is just one time magic or there is something behind it that worth of your attention.
This module is described in Classes as well: http://www.timingsolution.com/TS/Study/index.htm
Planetary Lines
This module is available in Timing Solution. See the documentation.
Neural Network Module
This is a universal forecast system that allows to make a forecast based on any astro and non astro event/events.
This is the list of the most used models in Neural Network module:
The model can be based on:
planetary speed (the description is here http://www.timingsolution.com/TS/Uphistory/upgrade_27.doc);
waxing/waning planetary phases (the description is here http://www.timingsolution.com/TS/Articles/waxwan/);
planetary positions (FAM model)
aspects between planets (improved Bradley model)
the old technique of planetary positions in different terms/faces (this is a surprisingly effective model); and many other things.
You could use midpoints, planetary pictures, Zodiacal positions, planetary hours (for intraday), and more.
Our strong point is that any of these models can be back tested providing a trader a solid background for his/her decisions.