Overview of cycle based models in Timing Solution
written by Sergey Tarassov
In this article you will find an overview of cyclic models that present in Timing Solution now (spring 2008) and are based on regular cycles. Timing Solution provides the wide variety of techniques based on these cycles starting with simple charting tools (that allow to draw any cycle manually) and ending with Back Testing module. (Regular, or fixed, or math cycles are not the only cycles in the program. Timing Solution is able to work with astronomical cycles as well; the astronomical cycles are discussed in another article. This article is devoted to the cycles that can be described by some math function.)
Charting tools:
Let us start with the simplest model. The most obvious understanding of cycles comes when we observe some regularity in the distance between turning points:
I draw these lines using "Equidistant Lines" charting tool by dragging the mouse from point A to point B. The good confirmation of significance this cycle is when other vertical lines point at turning points as well. We can draw these lines using calendar time or trade days only (excluding holidays and weekends).
If you would like to deal more with cycles, try another charting tool, "Harmonic Wave". It allows to draw a sinus wave over the price chart:
You may draw the same sinus wave together with its overtones (2nd and 3rd):
There is one more charting tool, "2 Wing Wave". With it, you may draw irregular waves, like this:
Or you may draw the wave that consists of four wings (A-B, B-C, C-D, D-E). Watch how this pattern repeats itself in the past and find out when to expect it again in the future:
Easy Cycle module:
Next step is "Easy Cycle" module. In this module you draw cycles manually. However the difference with charting tools above is that you can combine several cycles here and create a composite cycle model:
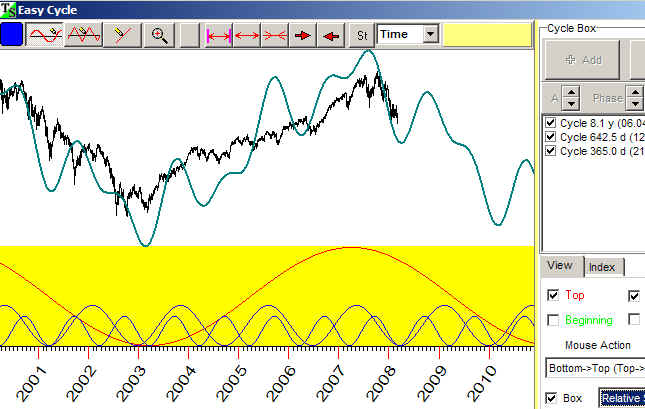
These options are designed to vary the parameters of each wave (its amplitude, phase and period):
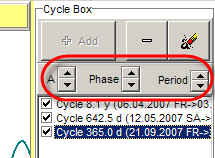
Thus you will be able to adjust your model to real price history data.
Here is one tricky thing here. Ask yourself what the cycle is? We can state: a cycle is something that repeats itself in time. What time do we use? It makes the difference as we can measure the time in a usual way - calendar days and normal hours, or we can measure the trading time in price bars. The explanation regarding this approach is here: http://www.timingsolution.com/TS/Study/Easy_Cycle/index.htm
Spectrum + ULE:
What we did above was just to apply the cycles idea, assuming that some cycles exist inside our price data. With that assumption, we could either draw the cycles or correct them adjusting the cycle's parameters. However, there is a way to reveal the most significant cycles for your data. Applying math methods such as spectrum analysis we find the strongest cycles easily:
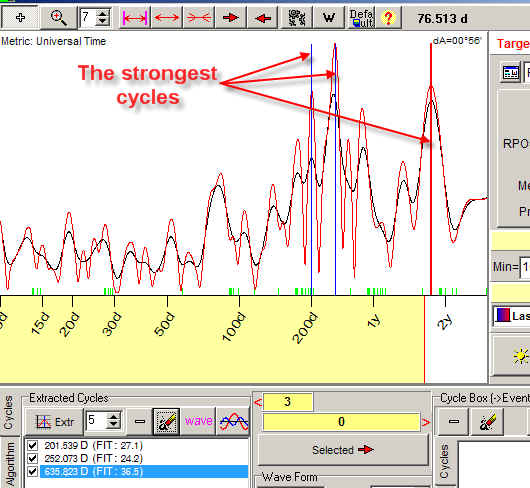
Then, by dragging these cycles into Main screen, you immediately get the projection line based on these cycles (three cycles in our example):
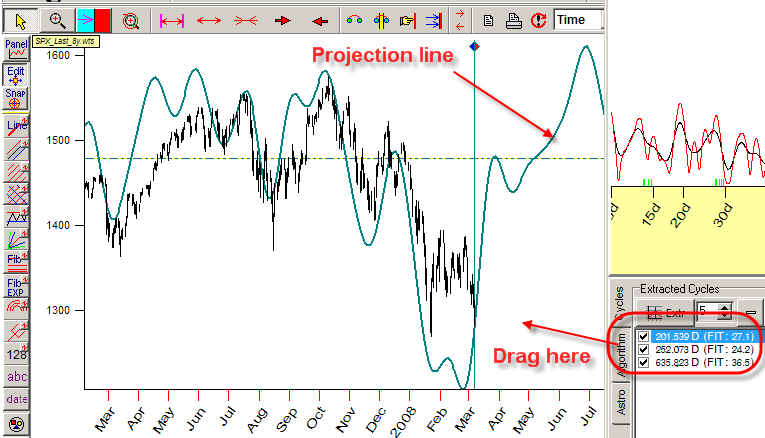
This procedure takes several mouse clicks and several seconds for calculation.
Play with different cycle combinations, amount of overtones ![]() and with different waveforms.
and with different waveforms.
This approach is very effective. It allows to obtain very easily the projection line based on advanced technologies.
More information about this approach is here: http://www.timingsolution.com/TS/Study/E/4.htm
If you apply this method to intraday data, see this: http://www.timingsolution.com/TS/Study/E/class_spectr_2.htm
Advanced charting tools:
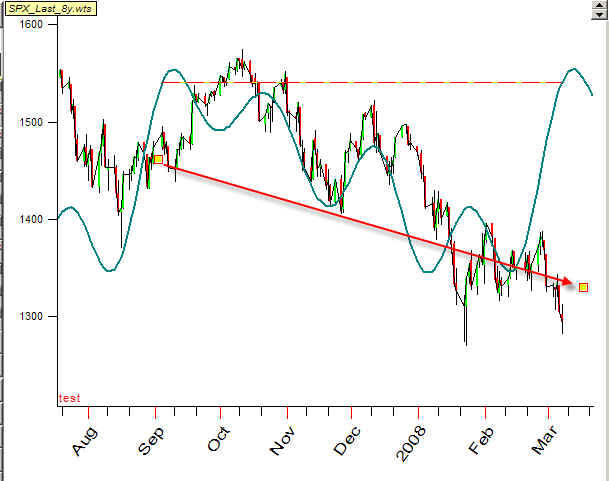
Here you can find new charting tools based on fixed cycles. It combines the simplicity of charting tools and the calculating power of nowadays computers. Let us look at the charting tool "Fourier string". What you do is just dragging the mouse from one point to another while the program performs the Fourier analysis for the price data within this interval and draws the projection line based on this analysis:
Another charting tool, "Harmonic string", allows to set the dominant cycles manually.
More explanation regarding these tools is here: http://www.timingsolution.com/TS/Uphistory/Advanced/
Planetary time
Let us return to the question above, how we measure cycles. You can calculate the cycle's period in calendar days. It is a regular way of understanding the time. As an example, we may say that the distance between two succeeding turning points is 35 calendar days. The variation of this approach is to calculate the cycle's period using trade days only (i.e. excluding weekends and holidays).
This approach is based on the Sun and the Earth mutual movement (or the angle between the Sun and the Earth). We can extend this idea and apply more sophisticated measures for time calculation. Say we may calculate the time using the angle between the Sun and Uranus. See the picture below. It shows vertical lines that correspond to the moments when the angle separation between the Sun and Uranus reaches 41deg 48min, 2 x 41deg48min=83deg 36 min, etc.):
Therefore, we have one more charting tool that works exactly as other charting tools: you simple drag the mouse from one turning point to another one. The difference is that you choose as well planetary combinations that describe the turning points the best way.
This is a very effective technique, read more about it here: http://www.timingsolution.com/TS/Articles/PT/index.htm
It is possible to calculate the spectrum using this planetary time. Look at this spectrogram calculated for the time that is measured as the angle between the Sun and Jupiter:
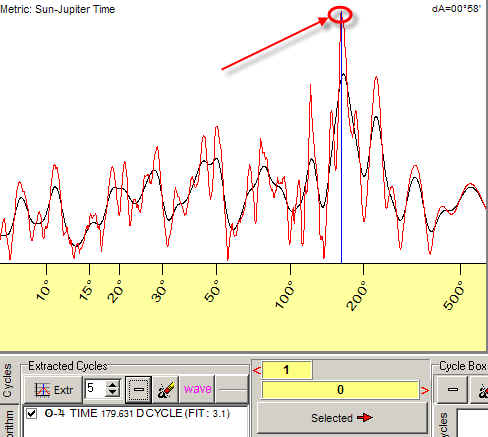
The peak around 180 degrees means that the price repeats its pattern while the angle between the Sun and Jupiter is changing within 180 degrees interval. It corresponds approximately to 200-days regular cycle.
You can work with these cycles as with usual cycles, i.e. drag it into Main screen and get projection line based on this cycle.
You can read about this approach also here: http://www.timingsolution.com/TS/Articles/Time_Metric_1/planetary_time_1.htm
Auto regression Model
Auto regression model (AR) assumes that price today is a linear (or nonlinear) combination of prices (or indicators) several trade days ago. Like:
Close today = A1 x Close 1 day ago + A2 x Close 2 days ago ....
In Timing Solution you can create practically all possible variations of AR models. Also (and this is the most important) you can create nonlinear AR models (using methods of Fuzzy Neural Network).
See here the results of back testing one of these models: http://www.timingsolution.com/TS/BT/Candle5/
Also I would like remind that MESA (maximum entropy spectrum) technique is mathematically equivalent to TS linear regression model.
Chaos Theory
Chaos Theory allows to reveal non obvious cycles - stochastic cycles.
Read here about them: http://www.timingsolution.com/TS/Articles/Chaos/chaos_ts.htm
Neural Network + Back Testing:
Neural Network is an universal tool of getting a forecast. It can work with any models created by you with the help of Timing Solution. Also, all models used in Neural Network module can be Back Tested. See more information about Neural Network technology on the website.