Forecast - first three steps (with updated sample forecasts)
What Timing Solution software does
Different people have different ways to learn about Timing Solution. They may find some info on the Net, they may hear something from Timing Solution users. Before buying the software, they usually ask me a lot of questions. Some want to know about the performance of Timing Solution models, some ask to make a forecast for their specific financial instrument. All of these are legitimate questions. I have tried to answer them with all I can. But... I have some ideas that I would like to share with you.
1) First of all, let's discuss a question regarding the performance of the models. I highly recommend to be extremely careful when somebody recommends/advertises/demonstrates you some high performance system. It should be a red flag for you. Some thoughts regarding this issue can be found in this article: http://www.timingsolution.com/TS/Articles/beware_good_system/index.htm
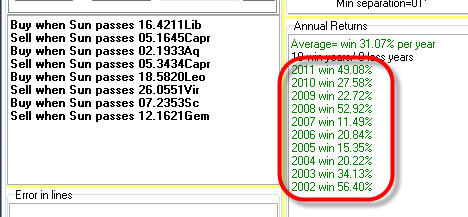
You see, Timing Solution is such a versatile system, with so many tools, that I can easily create a fantastic trading system. It will demonstrate you really good results, like this one:
This trading system makes eight tradings per year and makes in average 31% annual return (see its year-by-year report). This is not cheating, these are real results calculated for a real financial instrument (S&P500). The trick is - this is the result of the optimization, i.e. real data from the past were taken and undergone some mathematical procedure. Everything is correct here, and you get the same results with the demo version of the software (and with a regular version, after the purchase). If you would repeat my steps and follow this strategy starting from the year 2002, you would get 56% return in 2002 , 34% in 2003, ...49% in 2011. However, nobody is guaranteed that this system will keep being so profitable in the future. Moreover, I can say with high enough probability that the return value will drop in the future. To get the real understanding of the performance ability of some system based on any model or idea (not Timing Solution only, any!), we should actually perform Walk Forward Analysis (WFA) for this system. It is a rather complicated and time consuming procedure; plus, the return amount calculated this way will drop drastically. I could send you this report (by the way, it is made with T17 module), together with the notice that it is not a recommendation for your trading, that everything you do with the software is yours (and only yours) responsibility. And then it will follow a standard procedure that you may already know from your own experience with other software packages, books and trading seminars: you bought "Holy Grail" (as you believe!), did not get what you expected - only to hear from a seller that past performance does not guarantee future success, and that is possible that your particular financial instrument has changed the pattern that it followed for the last 10 years. These excuses leave you frustrated... Is it familiar? Now you know why I prefer to send you a demo and let you to try the software any way you like - instead of convincing you with high performance reports.
2) Second, the main feature of Timing Solution is the possibility to generate and verify the projection line. It covers practically everything known today regarding cyclical analysis. And this is not a set of techniques only. This is a process in progress as we constantly incorporate new technologies that may be useful for market forecasting. For example, within the last two years we have developed wavelet http://www.timingsolution.com/TI/7/index.htm and quantum models http://www.timingsolution.com/TS/Articles/quantum/index.htm. This is also a community of traders who trade a big variety of financial instruments and use different trade styles. And this is also a technology. We analyze the incoming information and develop the most promising technologies. This is a union of professional scientists and professional traders.
3) Third, we do not have working forever models. The models must be updated constantly due to a changing nature of the financial markets. We always monitor several possible scenarios for the future movements.
4) Fourth, on a regular basis we do a review of the most promising techniques. This is the last one regarding the forecasting for daily charts:
http://www.timingsolution.com/TS/Articles/new_fast_intro_2011/
Now, let me show how any person new to the software can make a forecast. You can do it with a demo version. Just keep in mind these four points discussed above.
So, we will make a forecast for Russell 2000 futures; price data analyzed are up to May 4, 2012.
Annual cycles
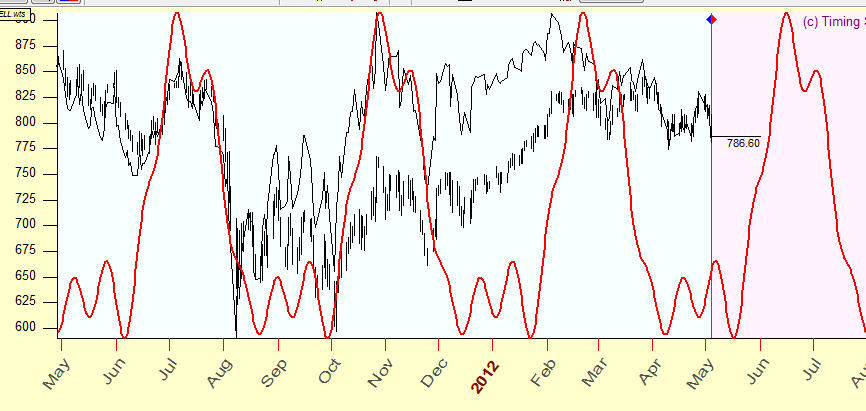
It is EOD chart. For this type of charts, we recommend to start with Annual cycle model. Look at these two projection lines based on the Annual cycle:
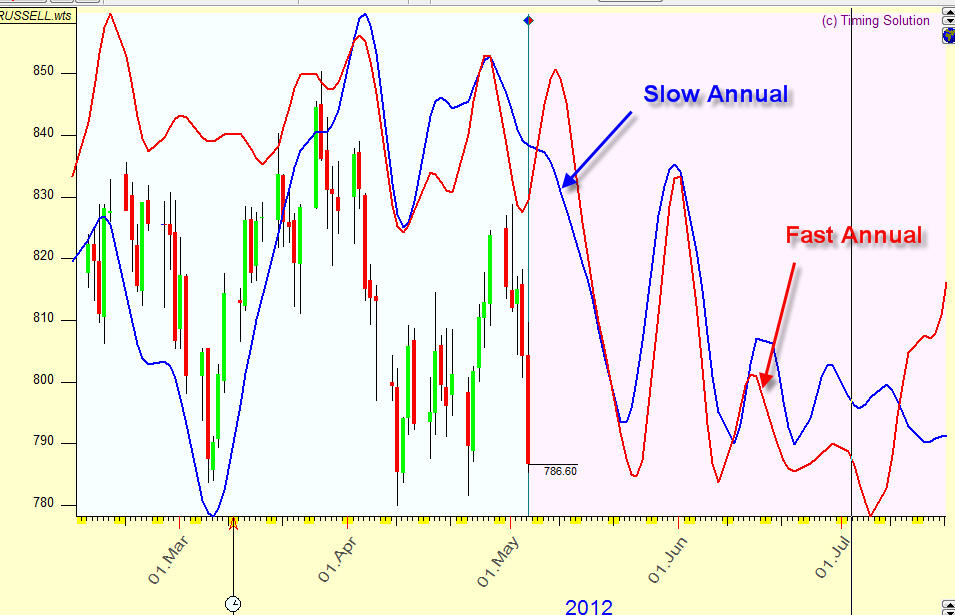
Blue - this is a forecast provided by the Annual cycle model calculated for the WHOLE available price history. It shows the general tendency;
Red - this is a forecast provided by the same Annual cycle model calculated for the latest THREE YEARS of price history data. It shows the latest tendency, i.e. how the Annual cycle model works recently.
Now we apply the standard committee technology, as for the same model we can calculate several projection lines. We do that to see all possible scenarios for this model. It is explained here in more detail: http://www.timingsolution.com/TS/Mini/12/index.htm
Pay attention to the moments when all of these curves (in this example, two) show at the same direction.
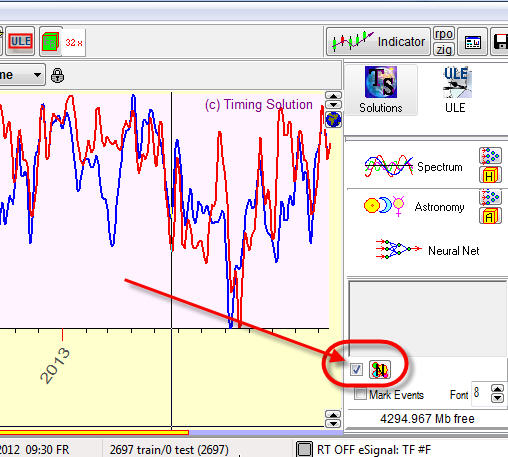
To display the Annual cycles, simply set ON here (Natural cycles module):
If all curves show the same direction, it is a strong indication of the future market movement.
Similar periods in the past
If Annual cycle is not working or if you would like to find more confirmation to its result, try to find the analogy in the past. Follow the menu "Pattern"->"Similarity"; you will get this:
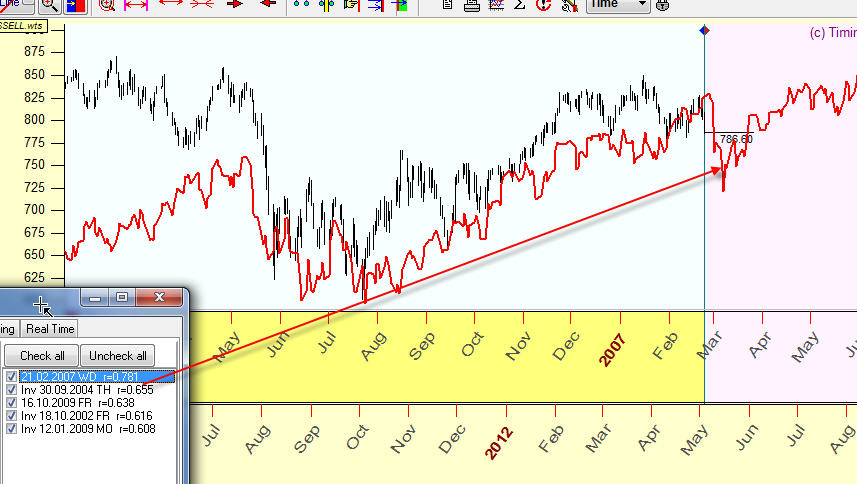
The program finds the most similar price patterns in the past. In our example, the first analogy sends us to February 2007. This analogy with 2007 (red curve) gives us some clues regarding future price movements.
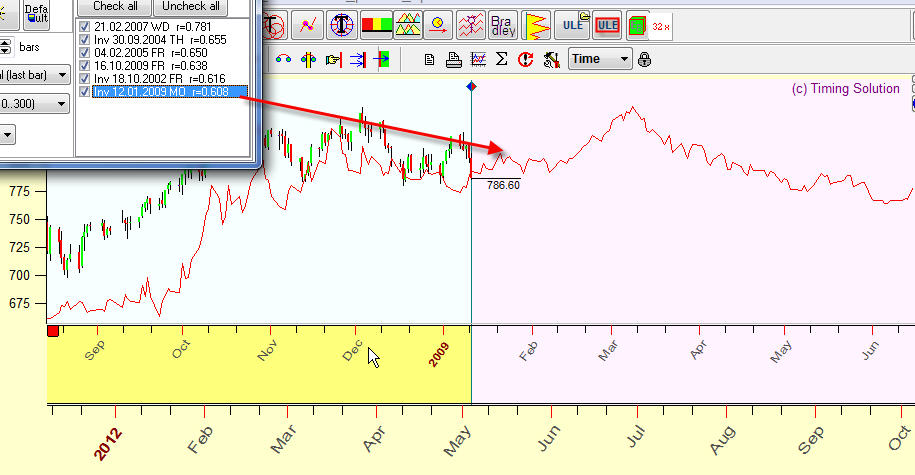
Highlight and browse all these similar charts one by one and choose the charts that visually look more reasonable. This is another analogy, with October 2009:
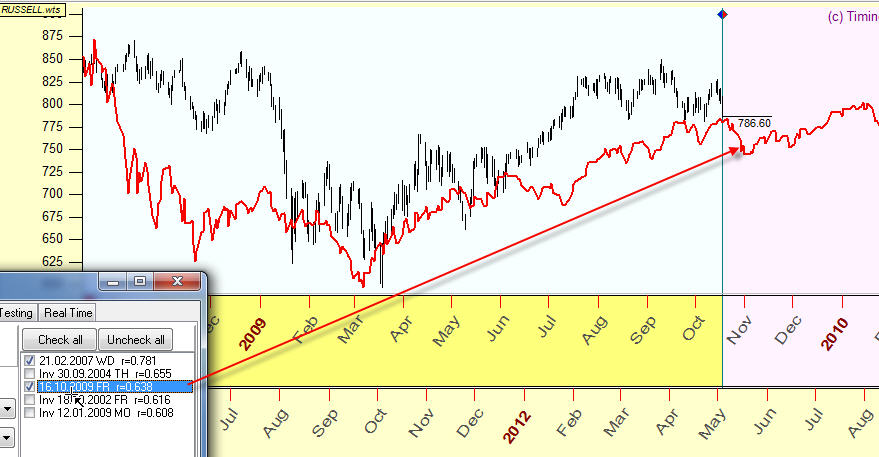
I have picked up two similarities from five provided by the program: an analogy with February 2007 and another one, with October 2009. All other similarities were disabled.
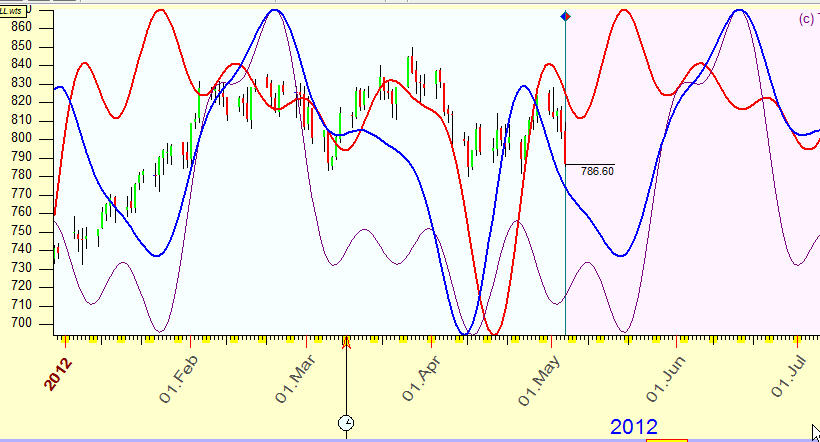
Now, highlight the committee option to see the superposition of these similarity charts (2007 and 2009 years analogy):
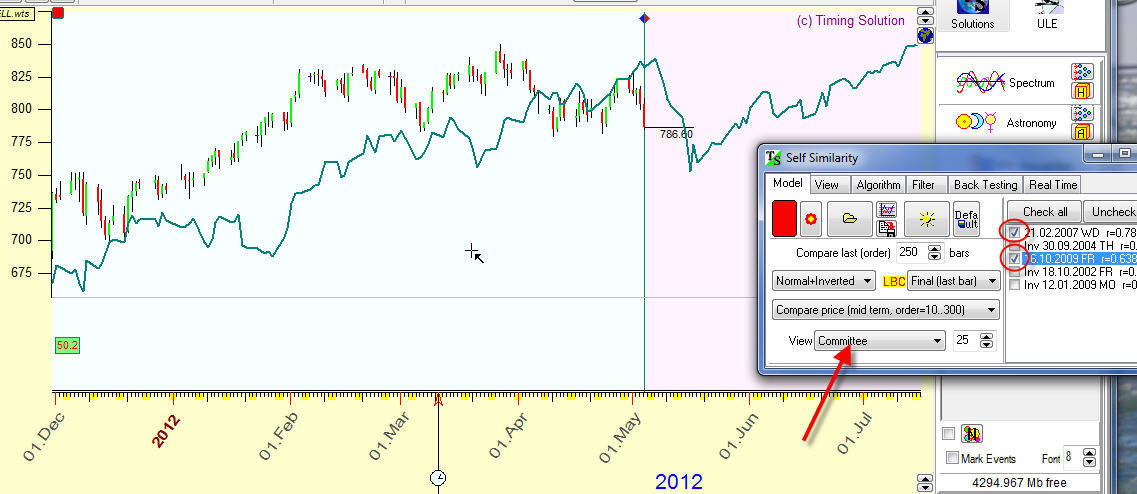
Here we use non formal criteria of choosing similarity charts: we take what "looks reasonable". Of course, we employ here formal math criteria (Pearson correlation coefficient). The program uses it to find analogies. However, this is just a first approach to this problem. The human brain can recognize the nuances that is practically impossible to catch using modern formal math algorithms. That is why we recommend to pick up the most important similarity charts manually.
Regular cycles
Now we try to create the forecast model based on regular dominant cycles. Click "Spectrum" button. You will get the periodogram: the peaks here correspond to the strongest cycles:
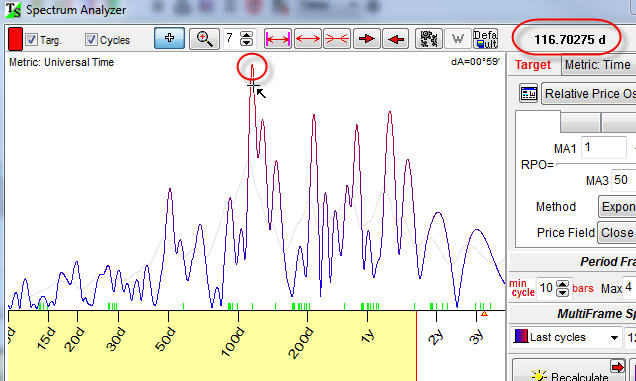
Look at the highest peak, 116 days cycle. It means that 116 days cycle is very active now. Now we want to see how this cycle works in time. In order to do that, make the mouse click on this diagram around this peak:
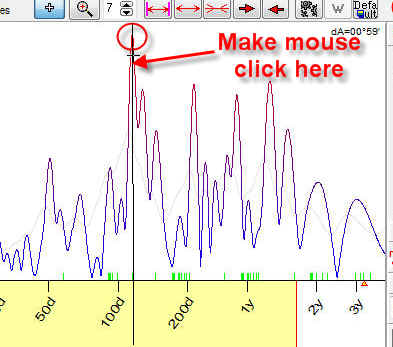
and look at the Main screen. This cycle will be displayed there (a red curve) together with the price chart:
However, for better understanding of this model we recommend to calculate a committee for this cycle. You can do it this way:
- drag this cycle from Spectrum module to the Main screen (or click ![]() button)
button)
- highlight "Committee" tab in the pop up window:
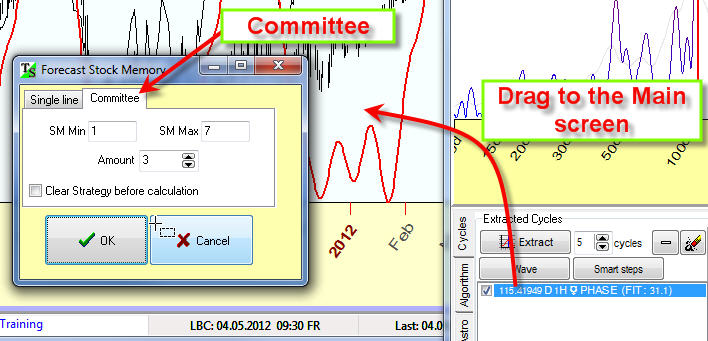
Here are three different projection lines that are based on the same 116 days cycle:
Alterations
We introduced above the most important forecasting models. We should keep in mind that any time the stock market can break all rules and choose a totally different way - for some reason not known to us. So we always should have some alternative future scenarios if the main models are not working. Here are possible alternative models:
This is analogy with December 2009 but here INVERTED chart is used:
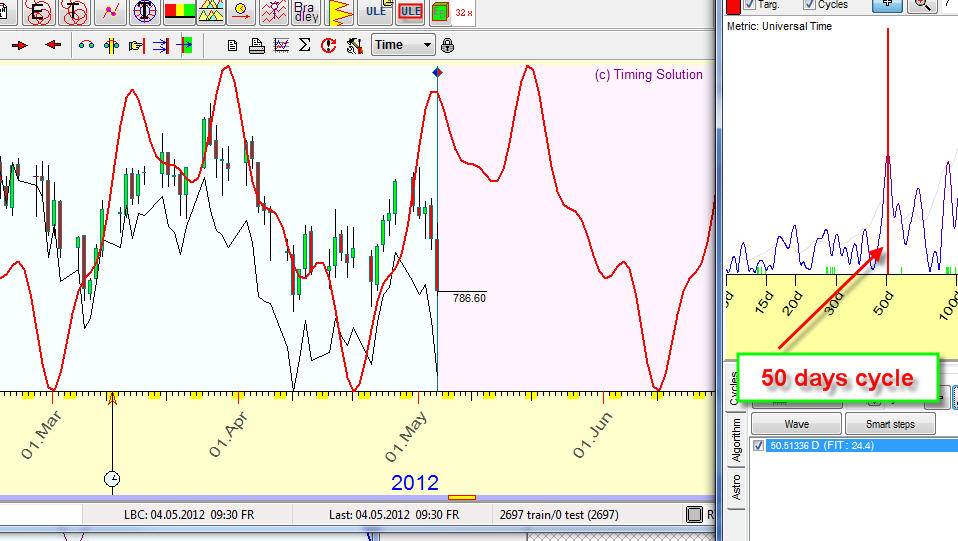
Another strong 50 days cycle:
Simplified backtesting
We have made a forecast together. This is a real forecast. And we have made it on May 4, 2012. Now it would be nice to put it aside and wait - let say - till September. We will know for sure how good it is.
But - what we can do today? It would be good to have a forecast, made somewhere in February, and compare it with the market data today. In this case, we could make some conclusion about forecasting abilities of the software now, without waiting for 3-4 months.
Timing Solution gives you this opportunity. You are able to know how this model would perform if you could apply it in the past. Do it as described below.
Imagine, that you have a time machine. And you moved back to February 1, 2012. And then you asked me to do a forecast for our financial instrument. So, I am back to February 1, 2012, too, and I do the forecast.
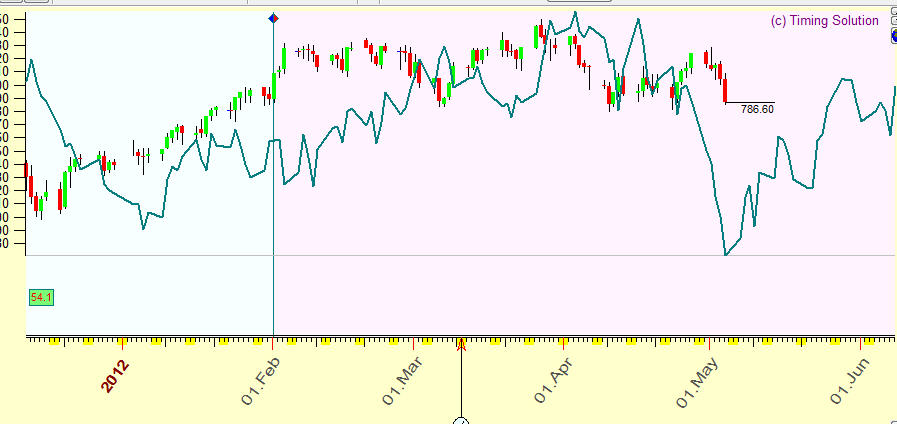
Move the mouse cursor to the date of February 1, 2012 on the price chart. Click the right mouse button and follow this menu item:
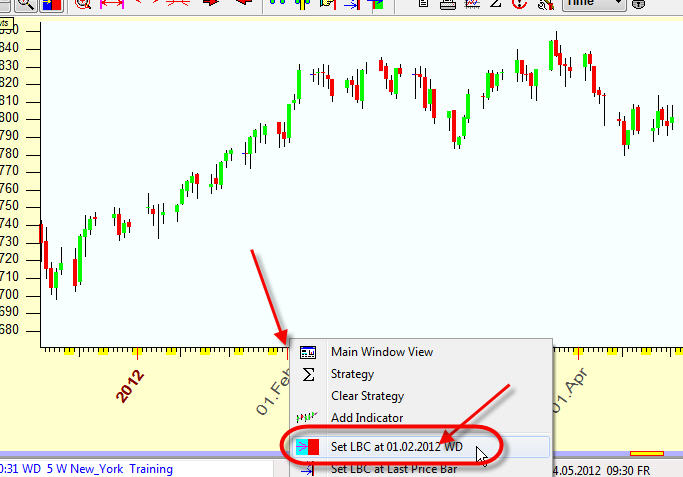
Now you see that the price chart is divided on two areas - before February 1, 2012, and after that date. The vertical line that corresponds to the date of February 1, 2012 is called LBC (Learning Border Cursor). It is a border between the data that the program uses for the calculation of all its models and the data that we keep as unknown - for the purpose of testing and comparison.
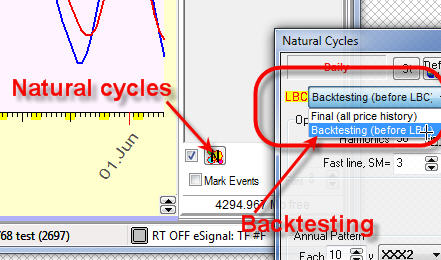
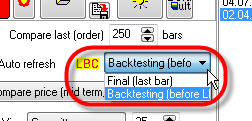
Run Natural cycles module and select there "Backtesting mode":
It is a forecast (that I would do for you in February):
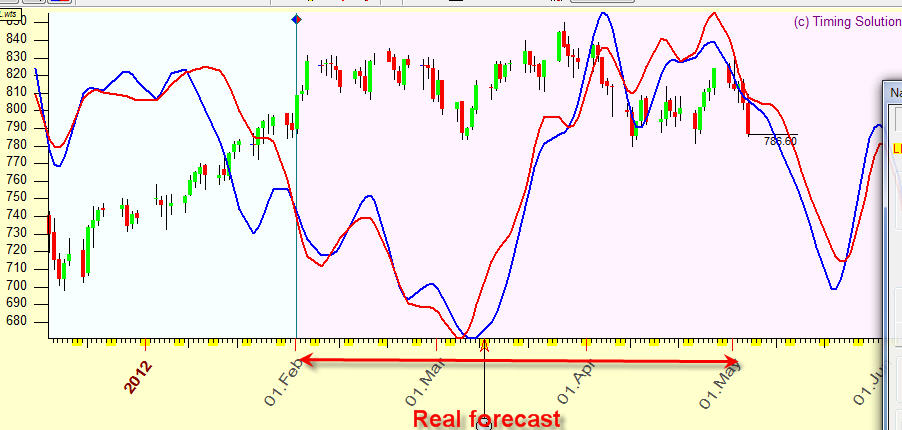
You can compare it with the real price chart (as we know it today).
Exactly the same thing can be done for Similarity module:
and forecast:
As to Spectrum module, it is different. This module uses automatically only the data before LBC while calculating any of the models. So, any time you move LBC, just recalculate the Spectrum. You can trust us that there is no future leaks in calculating the forecast models.
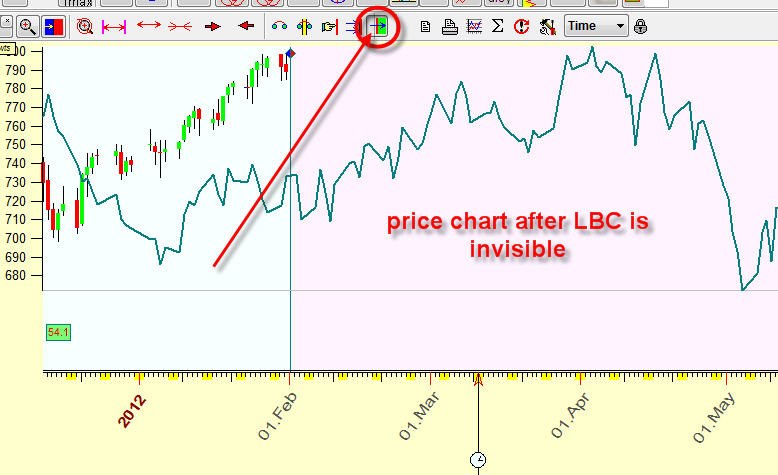
Sometimes, especially when you have to rely on your visual evaluation in the process of choosing the models, the data that you see after LBC can be a kind of psychological future leak. We recommend you to hide this info. It is very simple to do, just click this button before you start your tests:
Afterwards
You can do all these things yourselves, with a demo version. The difference between it and a regular version is that the demo version has some restrictions - like you will not be able to do the forecasts later than some specific date; this date is changing. The regular version has no such restrictions. Plus, the regular version has many experimental features.
Try it. Try to understand whether this software meets your goals and fits you well enough. If yes, welcome aboard, be a member of Timing Solution community.
May 5, 2012 Sergey Tarassov
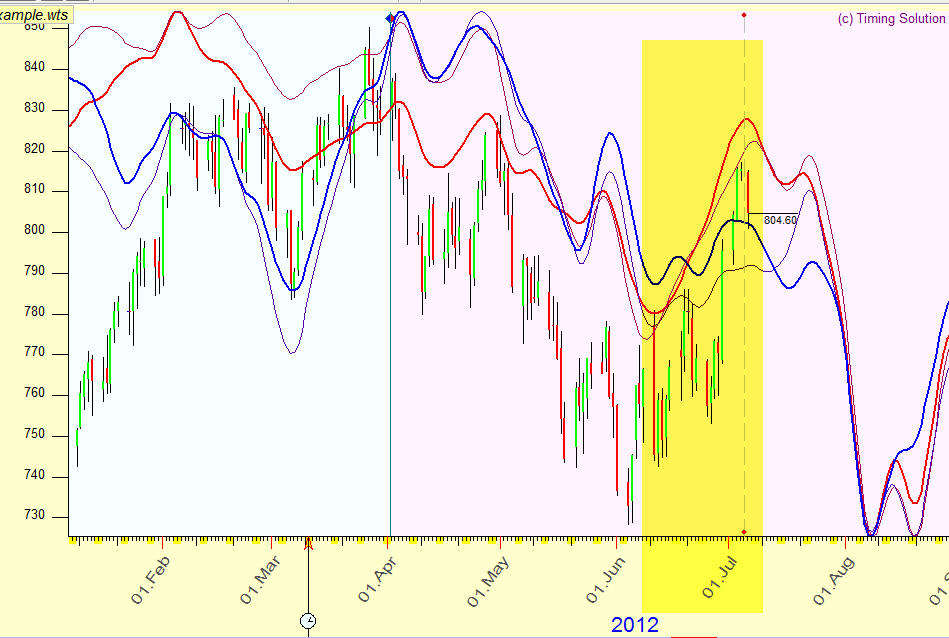
Below you can see the forecast we did a month ago (May 5,2012), together with the actual price chart. The forecast area is marked by a yellow bar:
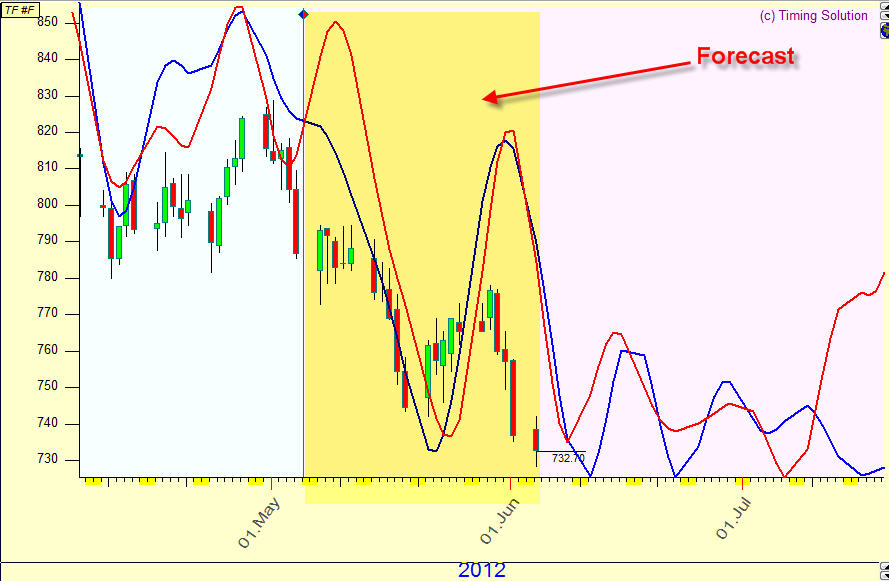
There was only one surprise there - a huge, practically panic drop at the end of May - in the beginning of June. The Annual cycle itself does not show a huge price movement at this time, the risky Annual zones are located in October and November.
We expect the next bottom here:
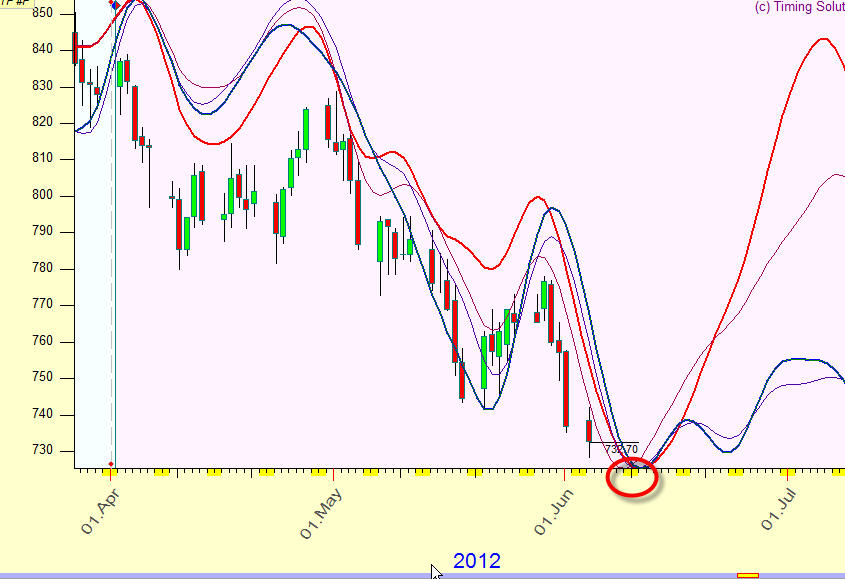
Technically speaking, the period since April till July is very "good" period for Annual cycle, and this period corresponds to the "predictable" zone of the Annual cycle.
Look at this:
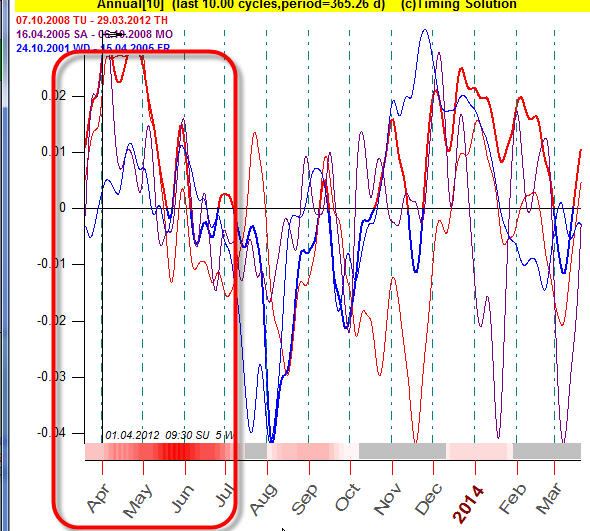
These are three Annual cycles calculated for three different periods: 2000-2005, 2005-2008 and 2008-2012. As you see all three diagrams point at the same movement in April-July.
We will see ...
Below you can see the forecast that we did a month ago (June 5,2012), together with the actual price chart. The forecast area is marked by a yellow bar:
Beyond the yellow bar is the latest forecast.
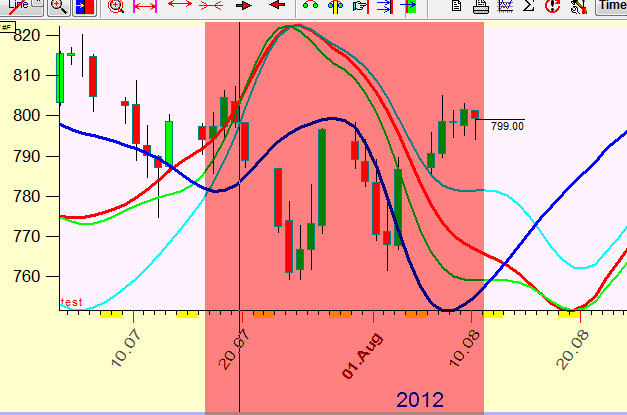
Forecast Update August 11, 2012
The forecast that I did is not doing well now:
What can we do in this situation?
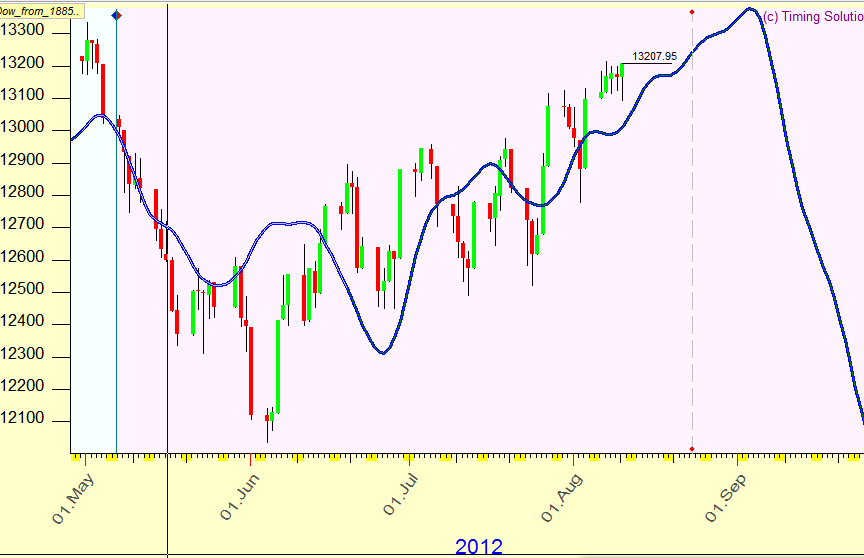
I recommend to extend the analyzed price history. I have downloaded the Dow Jones Industrial Index since 1885 year (most of indexes correlate with DJIA very well). This is Annual cycle calculated for 125 years Dow history:
Here are two Annual cycles: blue - slow Annual, red - fast Annual (the explanation how to do them is in the beginning):
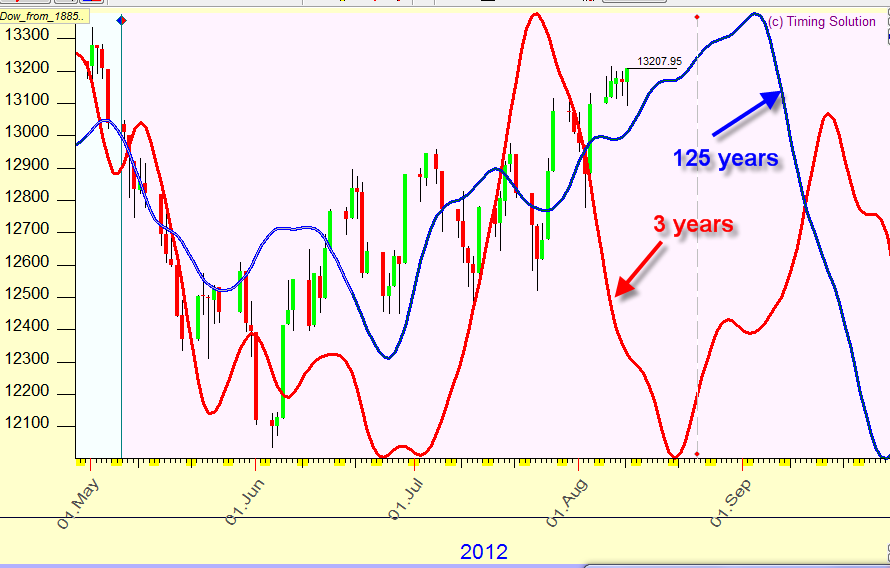
I really don't know what scenario will be chosen: tomorrow drop (August 13, 2012) or rally till September drop (the beginning of September).