Timing Solution: the most workable techniques
Working with daily chart
Introduction
In this article let us discuss the steps that any Timing Solution user must fulfill to be able to use the software at its fullest. Timing Solution software covers a wide range of different techniques. For a novice, this may be very stressful, as there is a chance of being overwhelmed by all these possibilities. The only way to handle this situation is to remember what techniques are the major ones, learn them well to become very comfortable with these modules, and only then study more advanced modules. It would be wise to move to more sophisticated parts of the software only after understanding really well these basic modules. You may have heard something from your friend, you may have attended some seminar regarding some exotic technique, or you may have read some book, - it does not matter how you have got the name of some technique. Try it in the program only after you have learned it enough as well as learned its prerequisites. For example, do not even try using Wavelet module if you do not quite understand how the Spectrum module works. You should always understand what you are doing, this is important.
General recommendations
1) Avoid using any exotic techniques as your main tool. It is quite typical as almost every trader dreams about finding some hidden key that opens a door to the stock market secrets.
However, it looks like the stock market does not have any hidden key. Metaphorically speaking, the stock market does not try to hide its treasure in some secret box or shell. Why? Just because such a secret box is the very first opportunity to be checked by market treasure searchers. Therefore, the better way would be to hide this treasure in very common though totally unexpected place. His Majesty Stock Market knows human psychology very well as well as the fact that majority of people watch things by eyes while seeing them by brain. It means that we see mostly what we expect to see, not what is really there. This is the truth that was known for thousands years, and modern technology and knowledge do not change this situation.
2) Accept the idea that His Majesty Stock Market can be unpredictable sometimes. Sometimes it starts playing new and totally unexpected Game ignoring all past experience. If the price behavior breaks any rules that you have applied, take it as a fact. Do not blame yourself, the model, or the software, - just be patient and observe.
Recommended Steps
1) Step #1: Annual cycle
this is the most important cycle. It works good for indexes, commodities less for currencies. You will find it anywhere.
This is Annual cycle for DJII:
Remember these Annual patterns for Dow Jones:
September drop -occurs in the beginning of September - the end of October, a very strong pattern;
Christmas rally - the end of October - the beginning of January, with a possible small correction in the middle of November;
Winter drop - the beginning of January - the beginning of March. In the beginning of March important bottoms occur often;
Spring rally - the beginning of March - the end of April (though this is a weak pattern);
May drop - the end of April - the end of June. This is a weak pattern as well;
Summer rally - the end of June - the beginning of September.
Annual cycles module is explained here: http://www.timingsolution.com/TS/Mini/49/index.htm
NOTICE TO FOREX TRADERS: for Forex financial instruments we recommend to apply Venus phase cycle, it looks like this cycle works for Forex better than Annual cycle:
2) Step #2: Similar periods in the past
the program searches for the most similar pattern in the past. As an example, look at the chart below. A strong analogy exists between 2005 and the time now (the beginning of May 2011):
Try different dates of the similar patterns this way:
What date is better to choose for similarity? Fundamental factors information is very important here. Similar periods in the past should be confirmed by some similar fundamental events.
This module is explained here: http://www.timingsolution.com/TS/Programs/pr/#A10
3) Step #3: Dominant cycles.
The idea of this module is very simple: the program calculates a periodogram to reveal the strongest cycles within the analyzed data. Peaks on this diagram correspond to the strongest cycles:
After that you can drag and drop these cycles on the Main screen to get a projection line based on these cycles:
Actually the program can perform these procedures automatically (like in Turbo Cycles module). However, it is better to perform them manually because you may miss some important hidden information that lies behind these cycles. Usually there are several cycles, all of them are strong, and we need to decide what cycles to pick up - one of them (the strongest), a combination or all.
What kind of information is it? Look at the periods of these cycles:
One of them, the cycle with the period of 116.54 days, is very close to 116 days' Mercury phase cycle; this is a good additional confirmation that this cycle is important.
Below is the list of cycles that are most typical for different financial instruments:
38-42 months Kitchen economical cycle
116 days - Mercury phase cycle
564 days - Venus phase cycles
around 2 years cycle - it looks like this cycle is tied with Mars cycle, like Mars-Saturn cycle
55 and 270 days cycles - I don't know the nature of these cycles
It is a good practice to pay attention to these cycles always.
This approach is explained here: http://www.timingsolution.com/TS/Study/E/4.htm
You may apply a wavelet technology as well to reveal dominant cycles: http://www.timingsolution.com/TS/Study/Classes/wavelet.htm
4) Step #4: Astronomical cycles
If you would like to generate a projection line based on astronomical cycles, better use Composite module. The most common example of such cycles is the Annual cycle. And it is not the only one that has a practical use. There are many other astro cycles that can be used to generate a projection line.
Below is the list of cycles that you should always consider first. It would be good if you memorize these cycles and their periods:
Moon phase cycle. You can define this cycle in Composite module this way:
Mercury phase cycle:
Venus phase cycle (often works for currencies):
Jupiter cycle Try it for long term data. This cycle is close to the classical Juglar cycle, here it is:
You can try other cycles as well, using different planetary combinations and Zodiacs; remember only that the cycles above are the most important ones. For example, the Moon draconic cycle is important for silver price. (Draconic cycle represents the Moon movement in respect to the North Node.) This is the composite for the Moon Draconic cycle:
Why is this cycle important? You see three different composite curves on the diagram above: red, purple and blue. They point approximately at the same price movement. Each composite curve was calculated for a different time interval. As these curves point at the same direction, we may expect that this cycle should work for a while in the future. This is "split criteria", it is explained here: http://www.timingsolution.com/TS/Study/Classes/class_comp_2.htm
So you should check different planetary combinations observing the consonance of different composite curves.
If you see that all composites based on the same planetary combination though calculated for different time intervals show different direction of the price movement, it means that this cycle simply does not work for your price data set..
This module is explained in these Classes:
http://www.timingsolution.com/TS/Study/Classes/class_comp_1.htm
http://www.timingsolution.com/TS/Study/Classes/class_comp_2.htm
http://www.timingsolution.com/TS/Study/Classes/class_comp_3.htm
http://www.timingsolution.com/TS/Study/Classes/class_comp_4.htm
5) Step #5: Annual committee
This technique allows to display different variants of Annual cycle (or any other cycle) to see all possible scenarios of price movement.
Committee technology is explained here: http://www.timingsolution.com/TS/Mini/12/index.htm
6) Step #6: Charting Tools
I think this is the most used part of Timing Solution software. However, it is very difficult for me to specify what charting tools are more/less important.
I recommend to read first this article regarding these techniques: http://www.timingsolution.com/TS/Study/ts_charting_tools/index.htm
Try Advanced and Astro Based charting tools. You can easily find Andrew's pitchfork, Fibonacci ellipses practically in any charting software, while Advanced and Astro Based charting tools are presented in Timing Solution only.
More advanced approach
When you get more comfortable with Timing Solution you may try more advanced techniques.
1) ULE - Universal Language of Events
This is the basis of Timing Solution software. Practically all models including the most advanced ones are based on ULE.
As an example, you can easily calculate the periods when Mercury (or any other planet) has been or is supposed to be retrograde:
Or calculate "retrograde index" - that shows how many retrograde planets are in the sky in any given moment:
Or calculate the tidal force for any place on the Earth:
Or show all conjunctions (or any other aspects) that were formed in the sky:
and many many other events. We constantly add new events to ULE module, and the most important thing is that we can generate the projection line based on these ULE events.
This is just one recent example: this year somebody has stated that some astrological event affects the stock market. This event is: Planet A applies to the planet B and separates from the planet C. To be more specific, consider this example as the Sun applying to Venus and separating from Saturn, i.e. the angle separation between the Sun and Venus is decreasing (applying aspect) while the Sun and Saturn's angle is increasing (separation). The program allows to see all time periods when this event takes place and compare it to any data set (like price charts). The most important feature of Timing Solution software is the possibility to use ULE events in Neural Network module and create forecasts/projection lines based on these events. And this is extremely easy! As an example, you need just a few mouse clicks to create the list of all possible planetary combinations in regards to the event discussed above:
Several minutes more - and the Neural Network module generates the projection line based on these applying/separating aspects:
To become more familiar with ULE, please see these classes:
http://www.timingsolution.com/TS/Study/Classes/class_ule_1.htm
http://www.timingsolution.com/TS/Study/Classes/class_ule_2.htm
http://www.timingsolution.com/TS/Study/Classes/class_ule_3.htm
http://www.timingsolution.com/TS/Study/Classes/class_ule_4.htm
2) Turbo Cycles
This module generates the projection line based on dominant cycles. This is
how the output of this module looks like:
It displays the period of dominant cycles and the projection line based on them. I recommend to run two (at least) Turbo Cycles modules and run them with different SM2 parameters:
Here I run two Turbo Cycles modules with SM2=1 and SM2=5. The first (red) project line reflects latest tendencies while the second (blue) line reflect more long term factors:
You can disable/enable any of these cycles or use your own cycle.
3) Optimized Bradley
Bradley siderograph is a very simple and effective forecasting model. You can run it here:
I would recommend to apply it together with the committee technique. I will show you how to do that.
This technology is described here: http://www.timingsolution.com/TS/Mini/12/index.htm#2
These are step by step procedures to obtain Bradley committee (just pictures):
a) run Bradley module:
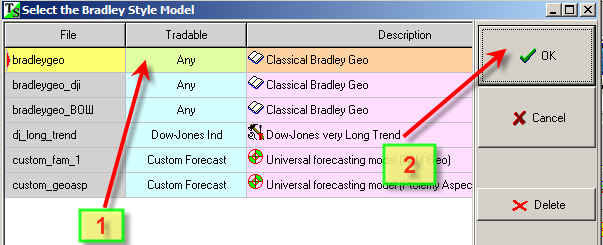
b) download Classical model:
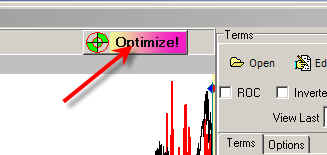
c) open "Optimization panel":
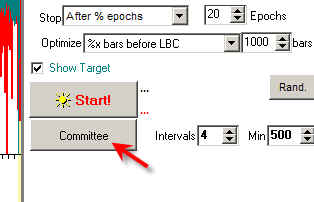
d) calculate committee:
e) all projection lines are in the Main screen now:
4) Turning Points Analyzer
This module allows to reveal support/resistance levels from the statistical point of view. Clicking this button:
 you will get this
colored diagram:
you will get this
colored diagram:
Read this diagram this way: if August 28, 2009 is a TOP turning point
(9630.20), the red stripes on this diagram represent the most probable levels
for the next BOTTOM turning point.
From the other side, if August 28, 2009 is not a turning point yet, set the
"Force" option OFF:
And the program will display the resistance levels for the most probable TOP turning point:
The program calculates these high probability zones analyzing zigzag proportions, so if the price history is not enough to provide the statistical analysis, we recommend to decrease the critical zigzag swing:
November 22, 2008 - Updated August 31, 2009 - Updated May, 2011 - Updated February, 2012 - Updated July, 2012
Sergey Tarassov
Toronto, Canada