Bartels significance test - the secret of lost pearl!
Arthur Shuster and Julius Bartels
When we speak about the cyclical analysis, or harmonic analysis, usually the first thing that comes to our minds is Fourier transform. The application of this method, by means of calculating a spectrogram (periodogram), was suggested and developed by famous British physicist, Sir Arthur Shuster. Arthur Shuster calculated the first spectrogram in 1899. Since then this approach has been developed a lot. Many books and monographs are based on this technique, and it is a mandatory part of university courses. The great ideas of Arthur Shuster have formed the main stream of the modern harmonic analysis.
There is one more great name that deserves to be recognized. It is the German geophysicist Julius Bartels. Julius Bartels made a great contribution to geomagnetism; he studied the effect of the Moon and the Sun on it. He has developed the alternative cyclical analysis approach that is known now as Bartels significance test.
Following the scientific research standards of his time, Julius Bartels had to apply some methods that could provide some statistical measure for the analyzed cycles. For example, scientists who explore the impact of the equatorial Solar rotation (24-29 days for different latitudes) on geomagnetic activity, - they need to get some statistical significance, something beside Pearson correlation. Before Bartels, physicists used to work with Arthur Shuster's approach focusing on finding the cycles. Bartels observed cycles that were already establish. In this case, the classical approach (periodogram) does not help too much. This was a hot topic and a subject of discussion (I would even say, "tension") between physicists and statisticians in 1930-1940. Julius Bartels proposed his approach while studying the geomagnetic activity. That same approach was used for research in economics (E. Dewey). The initial idea was really a brilliant one. However, for some reason, nowadays, 90 years later, - we still do not know much about Bartels significance test; this is definitely not the main stream in the modern harmonic analysis. What has happened? Why is it so?
It looks like there was a mistake made in the original publication of Bartels significance test; we will discuss that later. Because of that mistake, the probability calculated by this method appears an unrealistically high: it is Exp(N^2); higher than the properly calculated probability (N- sample size). As a result. now, 90 years later, this approach is not commonly used as it should be.
My personal story of relationship with Bartels significance test is a good illustration of what we have missed. I have heard about Bartels test practically from the very beginning of Timing Solution project, 17 years ago. During all these years, the users of Timing Solution software asked me from time to time to incorporate it into the program (mostly, they have learned about it from the activity of the Foundation for the Study of Cycles). This question appeared practically every month of these years (it is kind of my personal Groundhog day). I was hesitant to give it a try. My reasons? One was that as a physicist in the past, I have not heard about it, though knew a lot about periodograms; add to that the fact that there are very few scientific publications on the subject. Another reason was that my main focus then was in finding the cycles that might be present in my data sets. I did that by calculating classical (Shuster's) periodograms. The periodogram that I received trying to replicate Bartels' approach - it looked very uncertain (why - that will be explained further). So, for the first glance, it looked like some reinvention of the harmonic analysis (which was already one of the most developed and highly demanded branch of mathematics).
Finally, this year, I decided to put an end to that story. I studied available open sources and conducted the detailed analysis of Bartels significance test. Here is the chronicle of my battle: https://www.timingsolution.com/TS/Articles/Bartels/index.htm .
And you know what? Going into details, I have found something totally unexpected to me:
I state that there is a mistake in the original Bartels significance test formula that makes a probability calculated in suggested way unrealistically high. Fixing this mistake, we get a significantly improved periodogram. In terms of quality (signal noise ratio), the periodogram calculated by corrected Bartels method is the best of what I have seen before.
See yourself how it works compared with classical approach:
Look at these two periodograms calculated for my test data set for superposition of 35, 76 and 125 days sinus waves:
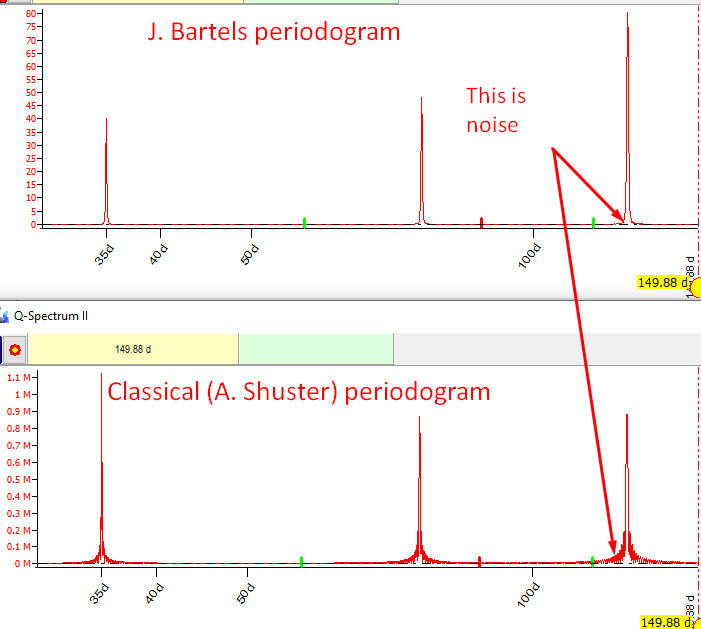
The zoomed chart shows that Bartels periodogram is 5-6 times less noisy than the classical Shuster periodogram:
What was lost
Here are more examples of application of these two approaches for physical and economical problems (modified Bartels and classical periodograms are shown):
1. This is spectral analysis for Sunspot activity index since 1818 till now:
Bartels periodogram looks much more clean than classical Shuster periodogram.
2. Let's try to reveal the major economical cycles that present in Dow Jones Industrial Index since 1885 till now, 135 years of price history taken into account:
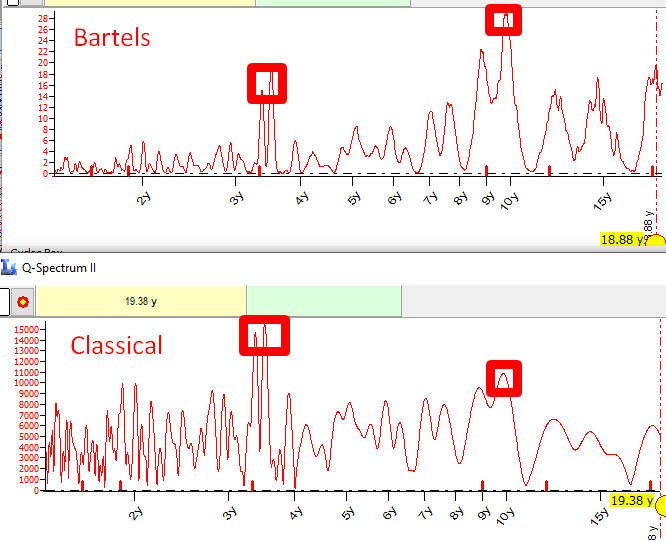
Both periodograms revealed major economical cycles - Kitchin 40 months and Juglar 10 years cycles, though as you see Bartels periodogram looks more certain.
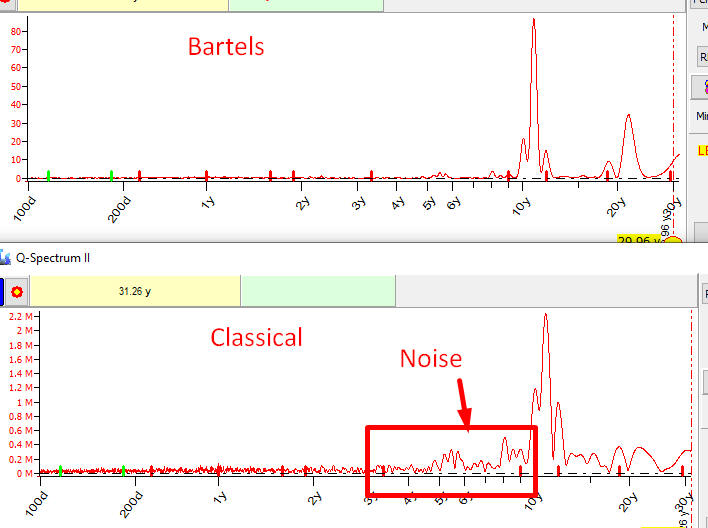
3. The advantage of Bartels periodogram is especially obvious when it is applied to big data arrays. Here are two periodograms calculated for Kp3H - 3 hours global geomagnetic activity index for 1932-1970 (in total more than 100K points):
The difference is obvious.
In all examples above the modified Bartels test applied, not the original one. The original algorithm contains an error that makes difficult its application to practical tasks.
To see how big this difference is, look at two periodograms for Kp3H index calculated with Bartels original algorithm and themodifieddone:one:
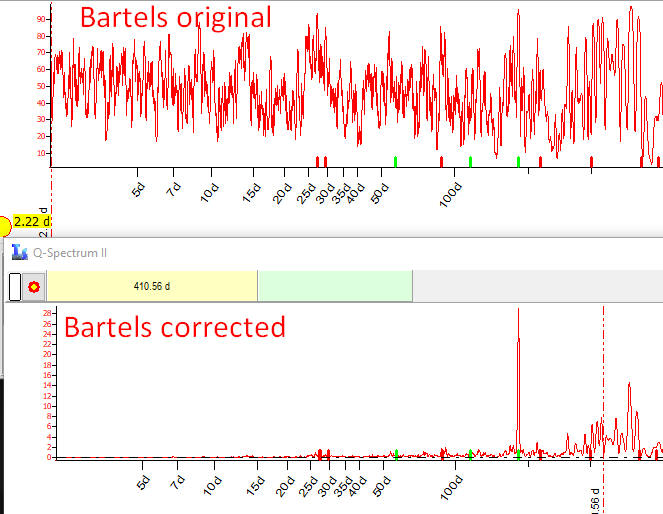
Accordingly, the periodogram based on Bartels original algorithm shows that practically any cycle has the statistical significance 50-60%. This is impossible.
Modifying the original Bartels algorithm, we have found something really good and useful. It looks like this sad mistake has closed the door for the future of Bartels approach. Bartels approach deserves much more. This is a real alternative to classical approach to harmonic analysis. I just want to bring your attention to this approach, it worth your time!
Julius Bartels idea explained
Classical cyclical analysis, or harmonic analysis, starts with Fourier transform. Its application to the tasks of modern science, especially physics, was developed by Arthur Shuster. Bartels was familiar with Shuster's works (see http://ui.adsabs.harvard.edu/abs/1934TeMAE..39..345B/abstract ) and suggested his own approach. Comparing the classical approach and what Bartels did, I was impressed by the mathematical beauty of Bartels approach. It really gives us something new.
To demonstrate how Bartels significance test works on practice, we apply this approach to KpH3 global geomagnetic index for small piece of data 1939-1940 (it is quite possible that J. Bartels worked with that dataset). There we will try to find a presence of the Solar equator rotation cycle. The cycle is well-known and described, its averaged period is 28 days. (Note the different approach to the same task: following Shuster, we would look for any cycle's presence while Bartels assumes that there is a cycle (28 days) and we will look for a proof of its impact on the analyzed data.)
In order to do that, let us divide the whole data set on 28 days pieces of data and name each piece as interval 1, 2,... The dataset covers approximately a year, so in total we have 12 intervals.
For each of these intervals we conduct a standard Fourier procedure finding the amplitude and the phase of 28 days wave adjusted for each interval. In other words, for each interval of these 12, we calculate "a" and "b" coefficients for this wave: X*cos(2 Pi*t/28)+Y*sin(2 Pi*t/28).
The next step is to put the vector (X,Y) on a harmonic dial:
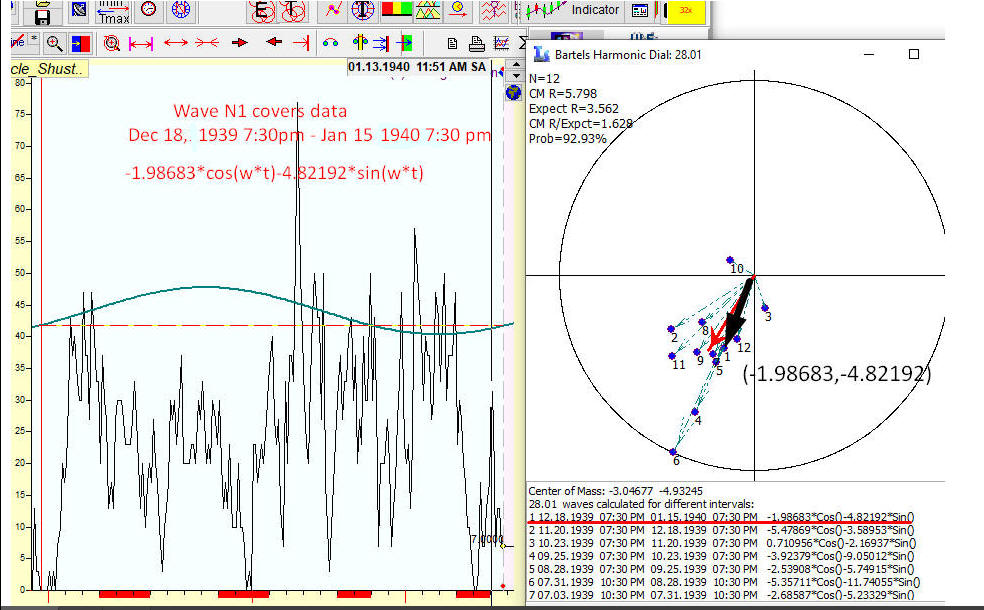
For example, look at the first first 28 days interval. It covers the time period from Dec 18 7:30pm 1939 till Jan 15 1940 7:30 pm. Applying the standard Fourier procedure, we get coefficients for 28 days wave's formula:
-1.98683*Cos(w*t)-4.82192*Sin(w*t)
where w=2*Pi*t/28.1 t- time in days starting from midnight 1900 GMT
We can represent this first wave as a vector on a harmonic dial, with the coordinates X (the coefficient for Cos) and Y (the coefficient for Sin).
We repeat the same procedure for other remaining intervals, from 2 to 11,
finding a and b coefficients for each one of them. After that we put
all these vectors on the harmonic dial:
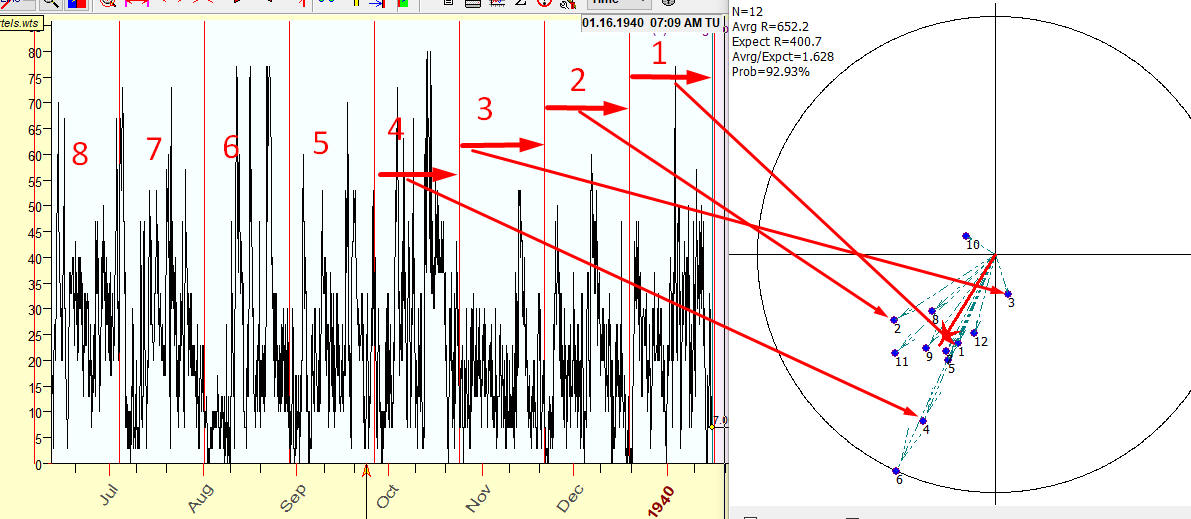
In the picture above 12 vectors are shown (Sample Size=12); they represent how the 28 days cycle works on each of these 12 intervals, how the amplitude and the phase has changed from one interval to another. If 28 days cycle has some impact on this dataset, all these vectors on the harmonic dial will form some cluster, some cloud. Ideally if this cycle works the same way for all intervals, all vectors will coincide. The closer vectors are located to each other, the tighter is the cloud - the better this cycle works for this data set.
This brilliant idea of Julius Bartels is one of the most beautiful mathematical ideas I know. We replace the standard harmonic analysis procedure by cluster analysis - giving by that the room for the statistical analysis, the statistical analysis that did not work quite well for approach suggested by A. Shuster (as it was discussed in 1930-1940s). It really brings something new!
So now we need to solve a statistical problem: finding the statistical measure of this cloud. The tighter the cloud is (which can be observed if all these vectors are closer to each other), the higher is the probability that the 28 days cycle plays a certain role in our dataset (is not "a chance occurrence", as Bartels puts it), the more the statistical significance of that cycle is.
In order to do that, let us conduct some simple calculations with Bartels harmonic dial:
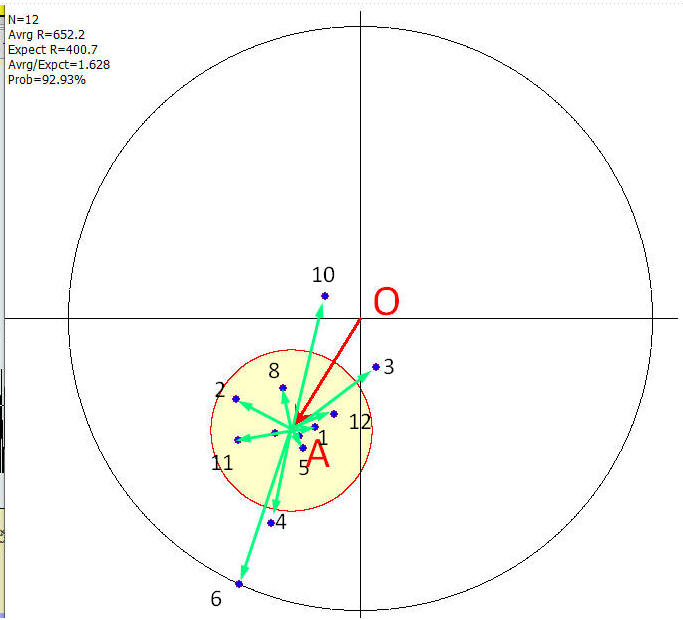
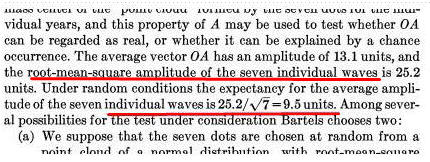
We calculate center of mass of these 12 vectors, point A (see below). It represents the expected amplitude and phase of our 28 days cycle.
Now let us look at how these 12 vectors are distributed in regards to the center of mass A.
We calculate the expected radius which is the root mean square of all 12 vectors with the center in A, root mean square of vectors A1, A2, .., A12. The small yellow cycle on the harmonic dial is the expected radius centered at point A. The smaller this cloud is and farther it is from the center O, the more statistically significant is the 28 days cycle.
We calculate the ratio (center mass radius)/(expected radius) and apply it for Gaussian exponent (assuming the normal distribution for these radiuses):
The statistical significance of 28 days cycle for Ko3H geomagnetic activity index is 93%.
TS team has conducted a lot of tests on many data sets; we have found that the probability calculated this way provides very clean periodograms.
Where was the mistake?
For some unknown reason, in all sources that were available to me - starting with J. Bartels work published in 1932 and ending with Charles E. Armstrong article published by Foundation for the Study of Cycles in 1973 - the calculation of the expected radius is shown as the root mean square of cloud centered vectors divided by square root of sample size. In this particular case (the example above), the application of the published formula leads to the expected radius being smaller square root (12)=3.46 times.
If I do the calculation according to the published description, the harmonic dial for our example looks this way, with the expected radius being unrealistically small here:
I have checked every digit In the Journal of the American Statistical Association's publication (June 1940), where Bartels technology was discussed:
As a model, the idea of Brownian motion was used, for the reason explained by Julius Bartels as being "low of propagation of accidental error".
This is another flaw.
Brownian modeling is preferable if there is some amount of consequent
steps: making N consequent random steps, our expected distance from the initial point
will be  . So the probability of us, after making N random
steps, to arrive at a point where we are K steps away from the initial point is:
. So the probability of us, after making N random
steps, to arrive at a point where we are K steps away from the initial point is:
where: 
To me, this is not our case. Instead of Brownian motion where every step leads to the growth of the cumulative error, we have a dataset that is constructed from smaller independent data sets, - that is how we get a cluster of individual vectors.
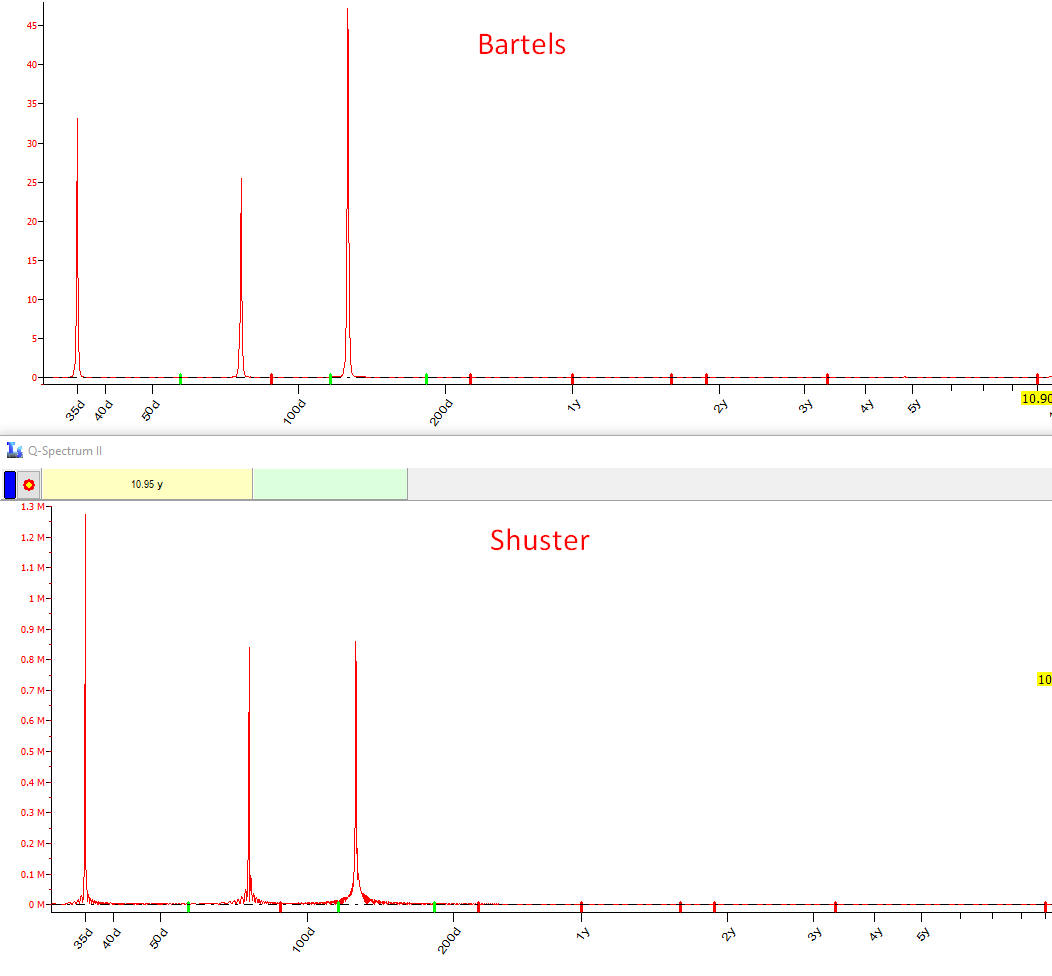
The two periodograms below are calculated using Bartels original and corrected algorithms for the test data set with 35 days wave. See the difference:
Bartels original algorithm provides the uncertain result and useless information: practically any cycle in the range of 34-36 days has 100% significance:
I did a lot of testing, tried to apply different formulas to reproduce the graph in the original paper; I simply have no idea what it can be if not a mistake. If I did something wrong here, I will appreciate if someone explains that to me.
Statistical significance versus Informational significance
Charles E. Armstrong in his article "Applying the Bartels Test of Significance to a Time Series Cycle Analysis" in 1944 mentioned: "The Bartels' test is not designed primarily as a mean of locating the periods of cycles present in a series. Its chief value lies in its application as a test of significance after the period has been located by some means".
Let's look at this problem from the point view of a physicist. It is the year 1944. In the world of science, the methods of mathematical statistics were finally refined and became a common practice in any research and decision making process. Our physicist did some research and wanted to know if 35 days cycle found in his dataset could be trusted. At that moment, two periodograms were available: Shuster's classic periodogram and Bartels' original (not corrected). Here they are:
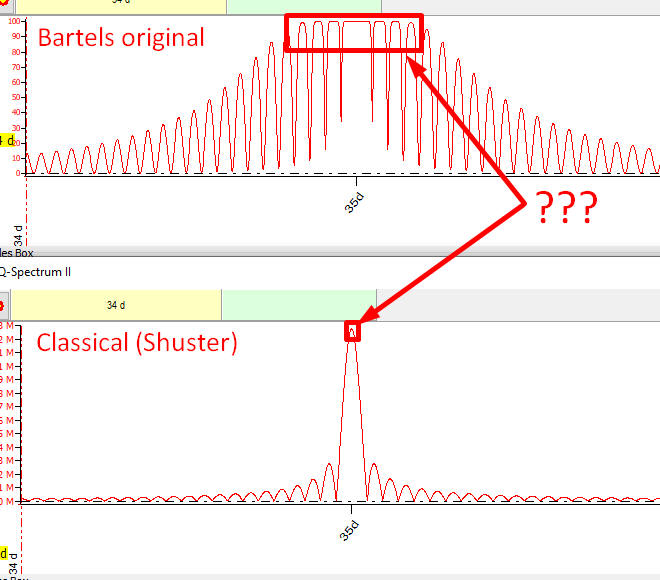
Bartels claims that practically any cycle in the range of 34-36 days has 100% statistical significance. It means that we have a close variety to choose from. That is why the published Bartels test (the original one) cannot be used as a tool to choose cycles. From the other side, the classical periodogram does not provide a statistical information, while the peak there precisely points at 35 days cycle. The first case (i.e. Bartels' approach) provides the statistical significance versus the second, that gives an informational significance. The statistics and common sense are in contradiction here, and guess what our physicist have chosen? In my opinion, this is a reason why Bartels' technique does not present in the university courses.
Applying corrected Bartels algorithm, we avoid this contradiction getting the best parts of these approaches. Now both periodograms point at the same 35 days cycle:
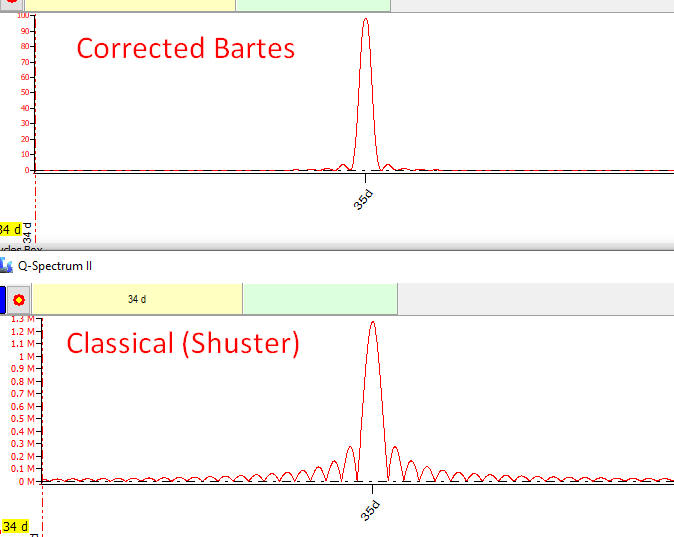
The corrected Bartels periodogram analyzes a cycle from the statistical point of view, while the classical Shuster periodogram does that from the point of view of that cycle's fitness to the analyzed data. As I see, in most cases both methods work together.
Ideal periodogram
Bartels test has its own side effects - false peaks that appear on small sample sizes, i.e. on big periods:
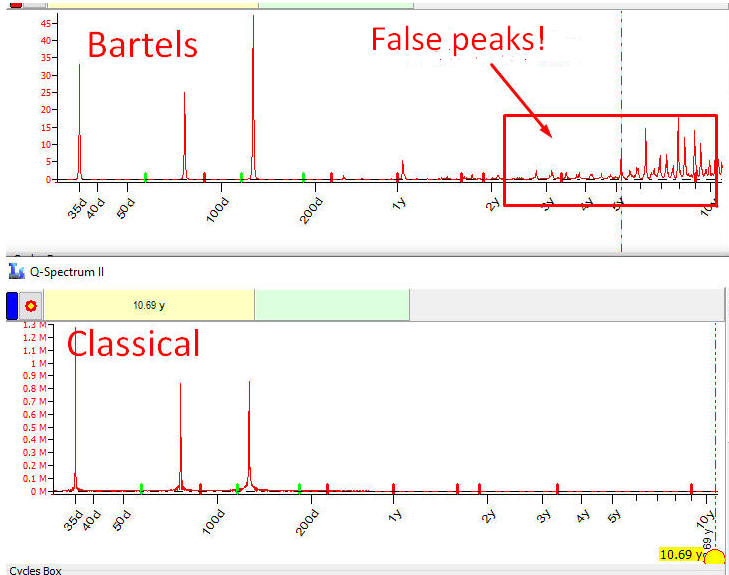
In the example above, the Classical periodogram is much better. Bartels' periodogram, starting from a certain period, shows lots of false peaks, peaks that represent non existing cycles. This is an artifact related to the resonance of used intervals to the false cycle. This side-effect appears for sample sizes 15 and less, i.e. when an available data set cover less than 15 full periods.
I have conducted some research of this side-effect and have found a solution. Because we divide the initial data onto smaller intervals, it looks like the resonance appears here.
Building harmonic dial for one of those false peaks, this is what was found:
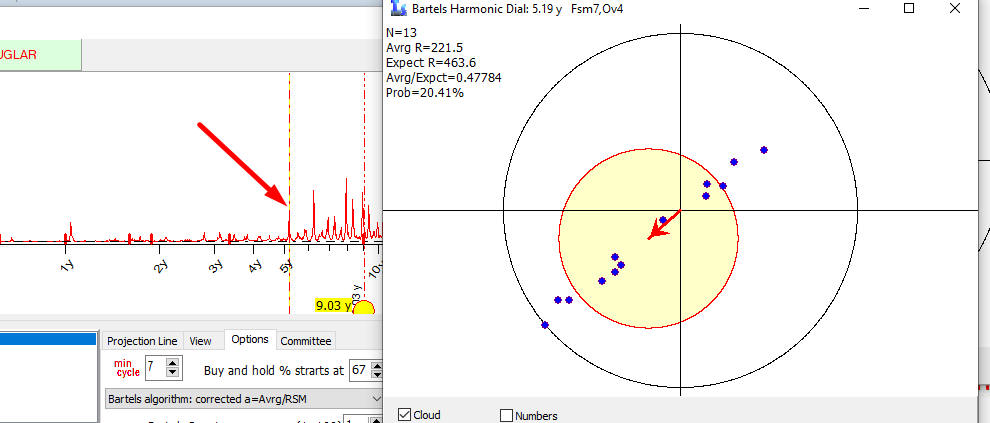
All vectors are lined up, they are synchronized by phase only.
To solve this problem, a different algorithm was applied.
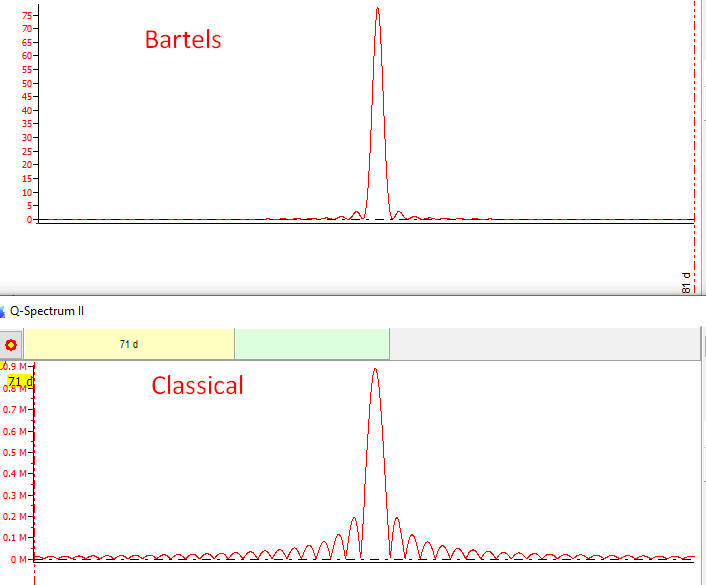
Look now at these two periodograms: Bartels corrected with the new algorithm to avoid false peaks and classical Shuster periodogram. I make a picture bigger, to show how Bartels' periodogram is clean compared to the classical one:
I have not seen so clean periodogram in my life. I worked with many versions of the periodograms based on classical Shuster approach, including more advanced ones (Fourier transform for covariance, different smoothing, etc.). There was nothing even close compared to Bartels modified periodogram. It was a big surprise to me!
Afterword
This article has been written with one purpose only: to deliver message that the periodogram based on corrected Bartels significance test works very good, significantly better than other algorithms. I feel myself obligated to do that, especially after ignoring this approach for 17 years.
I am really sure that, if would not that sad mistake, the main stream of modern harmonic analysis would look differently. The algorithm is explained here - try it. I hope we will be able to fill this 90 years gap.
The last thing: my deepest respect to (alphabetically) Julius Bartels and Arthur Shuster. They did the best of what was possible at their non-computer era:
"If I seen further, it is by standing upon the shoulders of giants" (Sir Isaac Newton)
Sergey Tarassov
Canada.
PS. I have a lot of test examples where different spectrums are compared. If someone has some special questions regarding the "renovated" Bartels significance test, I am glad to answer and help with promoting this technique for a wider use by modern science.