written by Sergey Tarassov
From time to time, users ask me to employ Bartels statistical significance test in Timing Solution. When it was mentioned to me the very first time, I was confused. I have studied harmonic analysis in my school, applied it to my job at a nuclear research facility since mid of 80s, - and never have heard about that test. Later, in 90s, when I began to look for math methods that can be applied to stock market analysis and forecast, I have read lots of scientific monographs related to different aspects of cyclical analysis, - and still, somehow there was nothing about it. It was strange. That is why I decided to study this subject in details.
Here is a brief description of my quest.
I have started with the inventor first. According to Wikipedia, Julius Bartels (1899 - 1964) was "a German geophysicist and statistician who made notable contributions to the physics of the Sun and Moon, to geomagnetism and meteorology, physics of the ionosphere". He started his scientific career at the period when the main scientific tool was the emerging mathematical theory of statistics. Bartels significance test was suggested while he studied ionosphere disturbance, specifically F2 layer of the ionosphere (100 km or 60 miles altitude). His research was in trend at this time. Remember? The end of 1930s, 1940s, WWII approaching and going, radio signal transmitting problems, so the studies of the ionosphere were just to the spot. Add to it the new tool for researchers - mathematical statistics (where Bartels made great contributions, too). It was a really good combination for a scientist:
We will discuss Bartels test as it is described in his work on studies of the correlation of the variation of F2 layer ionization with 11 years sunspot cycle, 27 days period of solar rotation and effect of Moon tidal force (i.e. Moon phases). It is available in open sources. For your convenience, I put it here: http://www.timingsolution.com/TS/Links/sdarticle.pdf
Let us look at it together.
First, the data. Bartels used 8 years of data. The amount of data is enough to analyze fast cycles (27 days and Moon tidal). Then he built a statistical model. The model confirms that these cycles are statistically significant for F2 ionization, so they can be used to create a forecast model.
Bartels divided the whole set of data into "pulses", i.e. on periods (27 days pulse or Moon phase pulse) and conducted Fourier transform for all these pulses, i.e. each of these one period pulse was represented as A*Cos(t+delta) wave, and all these waves were presented as harmonic dial (that is the name for the charts below):
Each dot there represents how this cycle works on each period pulse. Analyzing distribution of these dotes on the harmonic dial, we can get a statistical significance of this cycle.
This idea was applied to research of cycles in economical data. For example, here: https://cyclesresearchinstitute.org/pdf/cycles-general/bartel.pdf (It is a reprint of the article by Charles E. Armstrong in No.12 by Foundation for the Study of Cycles; I have found it by googling the theme; it will be discussed later.)
Though the Bartels work is a good example of a proper scientific research, I still was not convinced that it can be of significant help in my own research of cycles in financial markets. So I kept digging.
It looks like this subject has more story behind. There was some related discussion around the time when Bartels test was suggested. We can take it as a battle between physicists and statisticians, and this battle took place in 1930s. Here is a view of this battle from the statistics' side:
http://www.timingsolution.com/TS/Links/01c054500c9e91156230f8f80.pdf
At that time, Arthur Shuster's periodogram was widely used in science, in any research where was a hint of a potential existence of something cyclical. It quickly became a classical approach. The periodogram provided a kind of a cyclical portrait of some data set displayed this way:
Now, in 2021, looking back, I cannot imagine how physics could exist without the application of this mathematical approach. It helps a lot in finding cycles to form a workable forecast model.
However, from the point of view of a pure statistics, this approach cannot be considered as good enough. If the goal of the researcher physicist is to find a cycle, the researcher statistician must prove that this specific cycle is not there by chance. To make a proper statistical analysis, control groups must be built and null hypothesis must be stated beforehand. Plus, Robert Shuster, suggesting his periodogram, used the name "expectancy" for the amplitude of cycles on the periodogram. It was convenient for him, though might be too much for statisticians, as the term "expectancy" was already in their domain, with a very specific meaning, there is no doubt there.
So I consider Bartels significance test as a kind of alternative addition to cyclical analysis that makes statistics and statisticians happy.
There is one more aspect here. Let us look back again at 1930s. At that time, the application of cyclical analysis for research in physics was beneficial. Also, the memory of the Great Depression was very strong at that time. There was a demand of the tools to forecast the next possible market crash. So why not to apply statistics (and Bartels test!) to the stock market data? That would be a natural step for economists and market analysts. And this step was made. One of the good examples of applying statistics and Bartels test to economical research is discussed below.
The Foundation for the Study of Circles has published a reprint of the article by Ch.E. Armstrong. It shows how Bartels significance test can be applied to confirm the presence of 41 month (Kitchen) cycle. You can see it on their website: https://cyclesresearchinstitute.org/pdf/cycles-general/bartel.pdf or by googling key words. Let us look at it together.
Monthly data of USA economic activity in 1899-1939 was analyzed. In total, it is 41 years of data, 12 x 41 months period. So, the whole data set can be divided onto 41-month pieces, totally 12 pieces of data.
For each of these 41-month pieces of the price history, the standard cyclical analysis was conducted, to find the amplitude and phase for this 41-month cycle. In other words, for each 41-month piece of the price history, we have its amplitude and phase, and we can put these amplitudes and periods on the harmonic dial:
Next step is to formulate the null hypothesis. Here it is: if 41-month cycle is not working (is not present here), all these points are located on harmonic dial randomly - no certain amplitude and phase. Otherwise if 41 months cycle works, these points should be distributed around the center of mass with some accuracy (sigma), they should form some cloud around the center of mass. Then we calculate this sigma using Brownian particle motion equation. If averaged distance between these points and center of mass is less than sigma, we have a statistical confirmation that this is not a random coincidence, i.e. 41-month cycle works.
In this case the statistical significance is 1/185, i.e. with the probability 100%*184/185=99.459% this cycle is present in analyzed data. From the statistician's points of view, the job is done: 99.459% is good enough to close this subject.
Still, we need to answer the question: does the application of Bartels significance test bring an extra value to financial market players?
As we have established, it was designed about 80 years ago. During that period, some things surfaced that need to be included. Let us look at them.
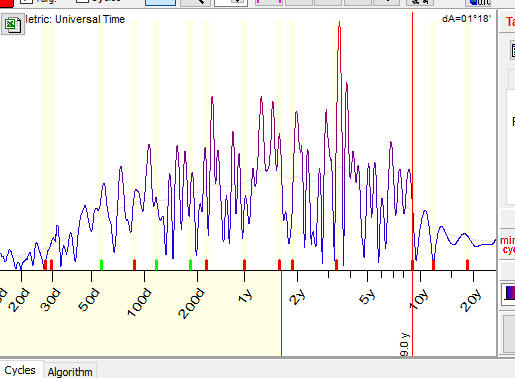
Since Robert Shuster introduced the periodogram as a tool to find cycles that are present in some data sets, the world of finance and science has changed a lot. Look at the Spectrum module in Timing Solution software. Many parameters have been added to the original version, each one of them reflects a certain stage in the genesis of harmonic analysis:
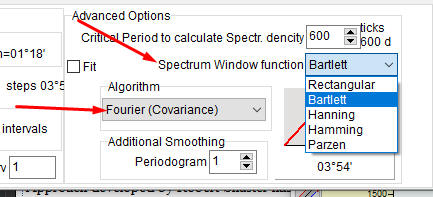
What you see on the screen above is the result of improvements suggested by different people, among and beyond Timing Solution community. The goal of those improvements was to extract cycles more and more precisely.
Bartels significance test is mostly used to get a statistical confirmation of the existence for already revealed cycles. It is a measure for existing cycles, not a tool to find some unknown cycles. Actually, Charles E. Armstrong mentioned that in his work.
Applying Bartels significance test for financial data is too risky. Let me explain why...
IMHO, Bartels test introduction reflect a faith in statistics that was typical at his time. If you do any research on cycles and get a statistical significance 1/185, - nobody would ask you any questions: the statistical significance of your findings is big enough. Now, in 2021, our reliance on statistics is not so solid. We tend to think another way: if we get a statistical significance 1/185, it might mean that we miss something in our calculations. The accuracy of 1/185 is too good to be true. And we have now some new tools to test it.
In 1987, the big drop in the market value took place. If we consider the stock market from the point of view of the conventional statistics, this kind of a drop can happened only once in billions and billions years. OK, there always is a chance that we were so "lucky" to meet such a unique event. But - we have had another big market drop that took place in 2008, and with a similar probability.
The fact that we know now and that was unknown several decades ago is this: the stock market does not follow the conventional statistics. This is so called effect of "fat tails" in statistics: http://www.timingsolution.com/TS/Articles/cds/index.htm
To reflect this new knowledge for financial data, I usually increase sigma 2 or 3 times. As a result, the probability of excess values is much more higher. It means that the statistical significance of the cycle in Charles E. Armstrong example varies in this range:
1/Exp((2.27/2)^2)=1/3.6 i.e. probability=72%
1/Exp((2.27/3)^2)=1/1.8 probability=44%
i.e. the statistical significance dropped 50-100 times.
Now, let us try to combine Facts ##1 and 2. From one side, we have an improved tool to reveal cycles (the evolution of spetrum/periodogram). From the other side, Bartels test works well for natural processes that follow the conventional statistics, while we try to apply it to financial data that are more responsive to its boundaries ("fat tails" effect)... Does it sound right to you? I doubt.
I am definitely sure that for the stock market it is better to apply Walk Forward Analysis (WFA) technique. It allows us to forget about all theories (conventional statistics or ...) and simply test our modeling for trading. We can focus on modeling the trading, and this is a totally different story.
I would recommend to apply firstly a classical Arthur Shuster periodogram to reveal cycles and then apply a confirmation algorithm like WFA. Also check if these cycles coincide with fundamental business cycles, if so, the cycle in question is a good candidate (this is core idea of cyclical protocol in Timing Solution).
To resume all the above, I can say that for those who want to work with cycles in the stock market data there are ways to work without Bartels test. I tried to explain my point of view in the posts to Timing Solution group at Groups.io. I believe now that I never heard about it while studying the cyclical analysis and actually working with it just because there were alternatives to it that proved workable with the time.
However, some of you may want to consider it further. Here are some thoughts for you.
I believe it makes sense to analyze this test from the point of view of information gathered.
Look at these several periodograms:
The periodogram below does not bring any information. It is close to "white noise" when all cycles are or are not present equaly:
The next periodogram shows a presence at least of one cycle (72-days cycle):
This cycle is still uncertain (its peak is too wide), but it is better than nothing.
And the last example, that shows a "good" spectrum, the peak here is much more certain and less noisy:
This is the evolution of cyclical analysis in Timing Solution, we are trying to make our cycles more certain, more informative.
We can call this feature as "informational significance" of a periodogram. For people who plan to apply Bartels significance test I would recommend to build similar periodogram for Bartels test instead of cycles, to understand the informational significance of this approach.
I love the idea of building a harmonic dial. This approach allows to see how the amplitude and phase of the analyzed cycle changes in time. I think it is worth to actually build a harmonic dial as an addition to Bartels test, as a visual analysis often gives more information than any formal approach. It makes sense to connect successive points by line to see how the amplitude and phase changes from one piece of data (or "pulse" as Bartels called it) to another.
Why I recommend to do a detailed analysis of harmonic dial? You may see two clusters on the harmonic dial chart, like these:
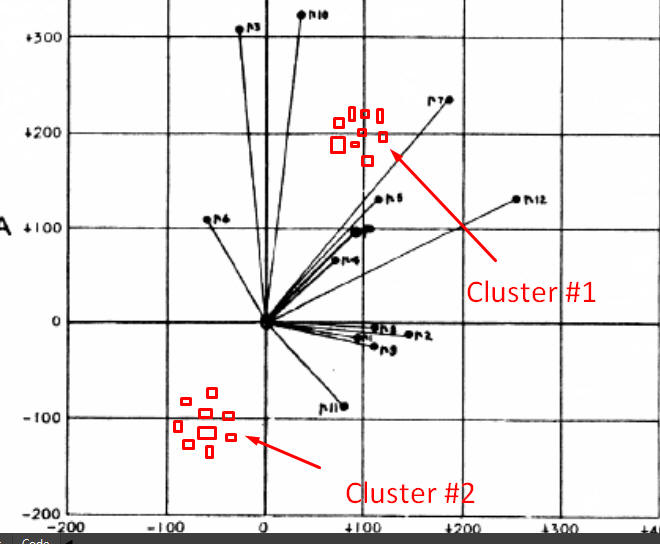
If you see two clusters it means that this cycle is able to change its phase on a regular basis, a kind of patterned cycle. One year such cycle works in a normal mode, next year - normal mode again, third - INVERTED, fourth - normal, fifth - normal, sixth - INVERTED etc. A conventional statistical analysis is not able to see such clusters.
I've met patterned cycles in astro cycles models: often Annual cycle works this way: several years cycle works in a normal way and one year it is inverted,
By the way, be careful if the phase changes too much. It may be a bifurcation point that can destroy this cycle. This is a subject of another mathematical advance that has been developed two decades later, - Chaos theory and Wavelet analysis. Wavelet analysis is a better tool to visualize the evolution of cycles.
I want to express my deepest respect to all great guys mentioned in this article. They did the best what was possible at their time.
August 8, 2021
Toronto, Ontario
Canada