Timing Solution guide: Level II
Working with daily chart
Keywords
Annual cycle, Annual committee, composite chart, predictable zones, Moon, Mercury,Venus phases, similar periods, Annual +Similarity divergence strategy, 116 days Mercury phase cycle, 564 Venus phase cycle, 38-42 months Kitchen inventory cycle, dominant cycle, Bradley model, Turbo cycles module, Turning points analyzer module, For Forex and commodity traders
Introduction
In this class let us discuss the steps that any Timing Solution user must fulfill to be able to use the software at its fullest. Timing Solution software covers a wide range of different techniques. For a novice, this may be very stressful, as there is a chance of being overwhelmed by all these possibilities. The only way to handle this situation is to remember what techniques are the major ones, learn them well to become very comfortable with these modules, and only then study more advanced modules. It would be wise to move to more sophisticated parts of the software only after understanding really well these basic modules. You may have heard something from your friend, you may have attended some seminar regarding some exotic technique, or you may have read some book, - it does not matter how you have got the name of some technique. Try it in the program only after you have learned it enough as well as learned its prerequisites. For example, do not even try using Wavelet module if you do not quite understand how the Spectrum module works. You should always understand what you are doing, this is important.
General recommendations
1) Avoid using any exotic techniques as your main tool. It is quite typical as almost every trader dreams about finding some hidden key that opens a door to the stock market secrets.
However, it looks like the stock market does not have any hidden key. Metaphorically speaking, the stock market does not try to hide its treasure in some secret box or shell. Why? Just because such a secret box is the very first opportunity to be checked by market treasure searchers. Therefore, the better way would be to hide this treasure in very common though totally unexpected place. His Majesty Stock Market knows human psychology very well as well as the fact that majority of people watch things by eyes while seeing them by brain. It means that we see mostly what we expect to see, not what is really there. This is the truth that was known for thousands years, and modern technology and knowledge do not change this situation.
2) Accept the idea that His Majesty Stock Market can be unpredictable sometimes. Sometimes it starts playing new and totally unexpected Game ignoring all past experience. If the price behavior breaks any rules that you have applied, take it as a fact. Do not blame yourself, the model, or the software, - just be patient and observe.
Recommended Steps
1) Step #1: Annual cycle, Annual committee
this is the most important cycle. It works good for indexes, commodities less for currencies. You will find it anywhere.
This is Annual cycle for DJII:
Remember these Annual patterns for Dow Jones:
September drop -occurs in the beginning of September - the end of October, a very strong pattern;
Christmas rally - the end of October - the beginning of January, with a possible small correction in the middle of November;
Winter drop - the beginning of January - the beginning of March. In the beginning of March important bottoms occur often;
Spring rally - the beginning of March - the end of April (though this is a weak pattern);
May drop - the end of April - the end of June. This is a weak pattern as well;
Summer rally - the end of June - the beginning of September.
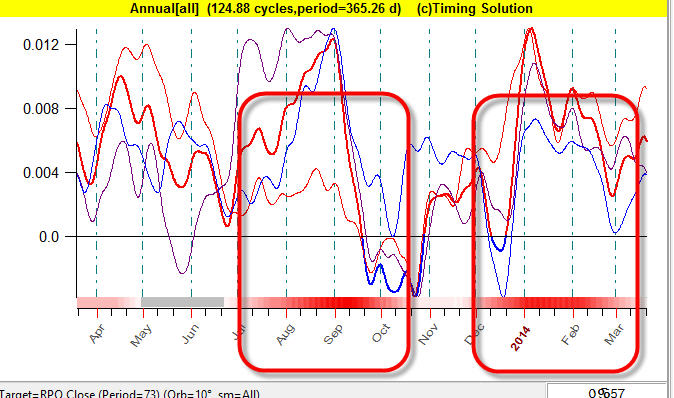
Also pay attention to these red stripes; they correspond to the most predictable zones, i.e. the periods when our projection line is the most trustable (this subject is explained here):
Click this button:
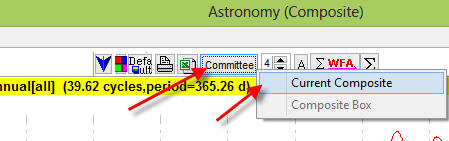
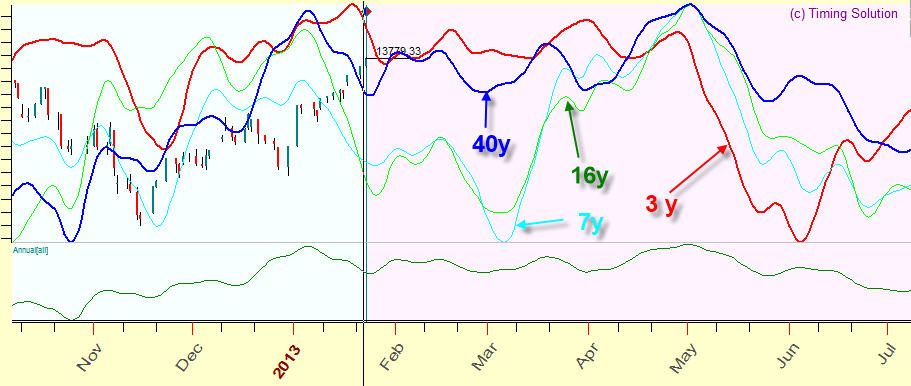
You will get four projection lines based on four Annual cycles in the Main screen. What is the difference between these projection lines?
Red projection line represents Annual cycle based on the latest 3 years of the price history, i.e. this projection line reflects the latest tendency of the Annual pattern. Blue projection line represents Annual cycle which is based on all downloaded price history (40 years in our example). Aqua projection line shows Annual cycle based on the last 7 years and green - based on 16 years. Thus you can see how Annual pattern changes in time:
We recommend to pay attention to the turning points that are confirmed by all projection lines. In the picture below three turning points are shown:
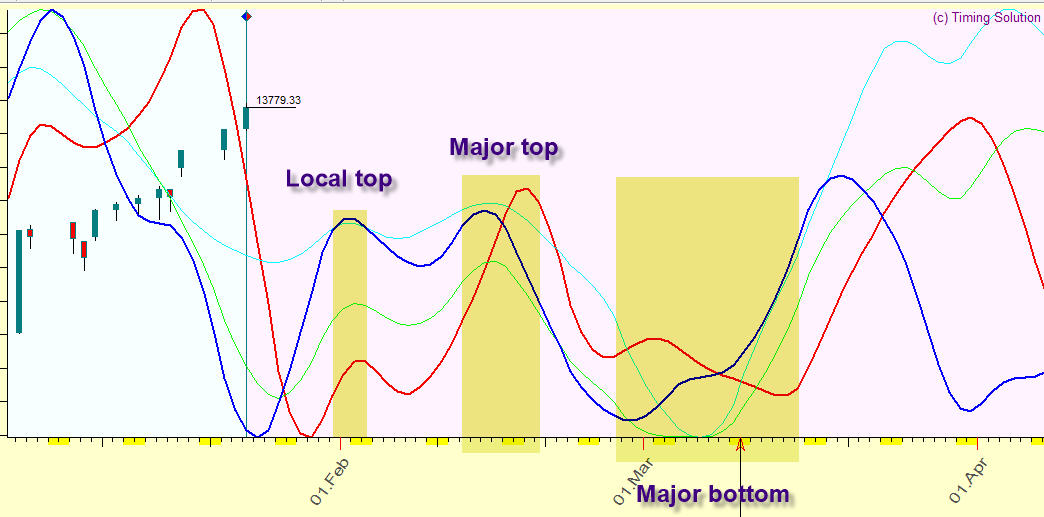
Local Top: January 31 - February 1 is perfectly identified by all four projection lines. However this is not a major top, it might correspond to some small correction move.
Major top: February 12 - February 20, here some downtrend movement starts, and it will go until the beginning of March.
Major bottom: end of February - March 15, this is the beginning of a spring rally, very stable pattern. It was in force during "bad" years of 2007 and 2008 as well.
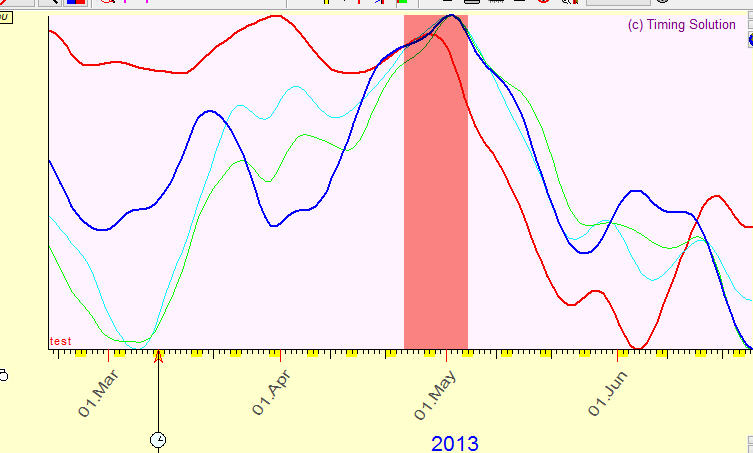
Usually this spring rally lasts until April 23 - May 5 with some possible correction at the end of March - the beginning of April:
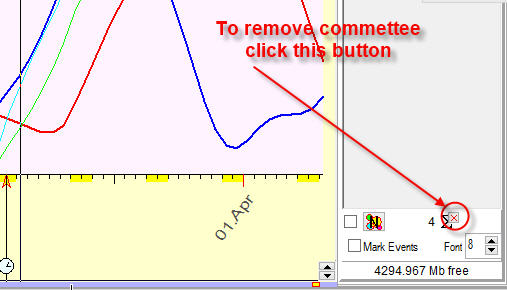
To remove committee, click this button in the bottom right corner:
2) Step #2: Similar periods in the past
the program searches for the most similar pattern in the past. As an example, look at the chart below. A strong analogy exists between 2005 and the time now (the beginning of May 2011):
Try different dates of the similar patterns this way:
What date is better to choose for similarity? We do not know exactly, it looks like fundamental factors information is very important here. Similar periods in the past should be confirmed by some similar fundamental events.
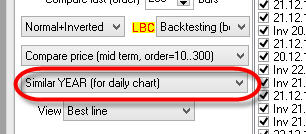
If you have enough price history (10 years and more), we recommend to use filters option. With it you can find the most similar year in the past:
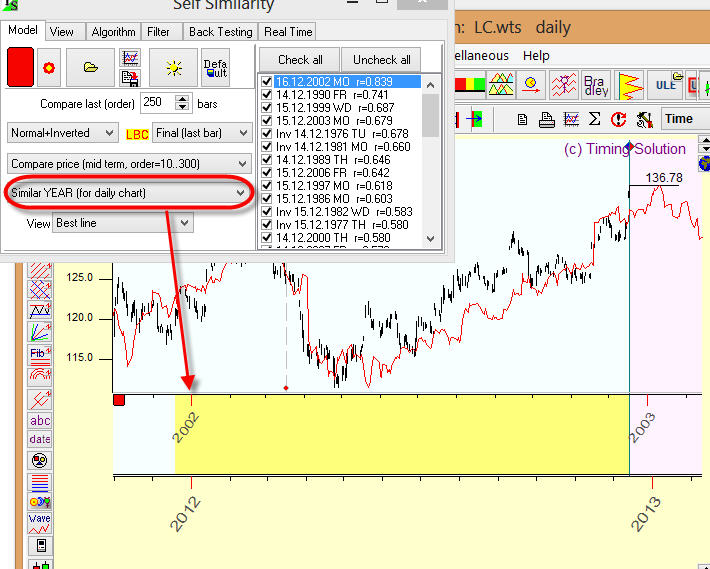
As you see, January here corresponds to January of the similarity chart, February corresponds to February similarity etc.
3) Step #3: Astronomical cycles
If you would like to generate a projection line based on astronomical cycles, better use Composite module. The most common example of such cycles is the Annual cycle. And it is not the only one that has a practical use. There are many other astro cycles that can be used to generate a projection line.
Below is the list of cycles that you should always consider first. It would be good if you memorize these cycles and their periods:
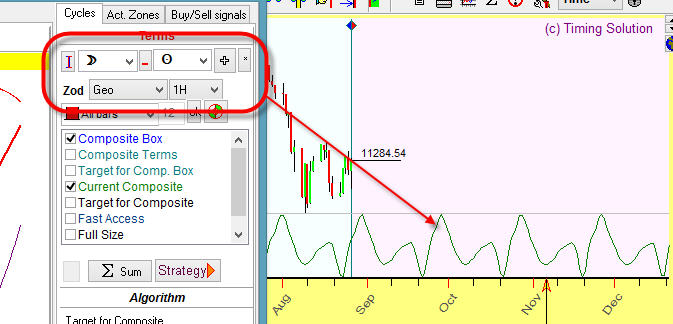
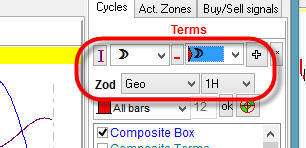
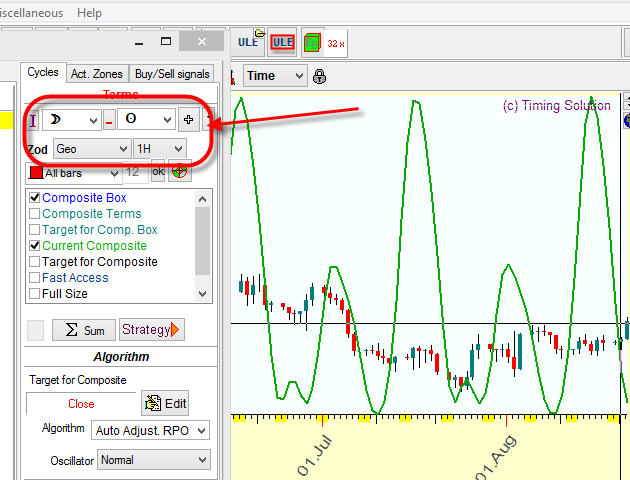
Moon phase (Moon-Sun geo) cycle. You can define this cycle in Composite module this way:
Moon tropical cycle (Moon-Moon geo)
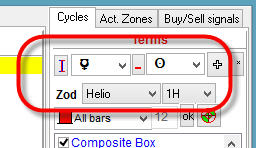
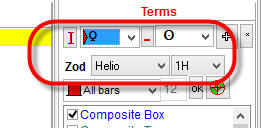
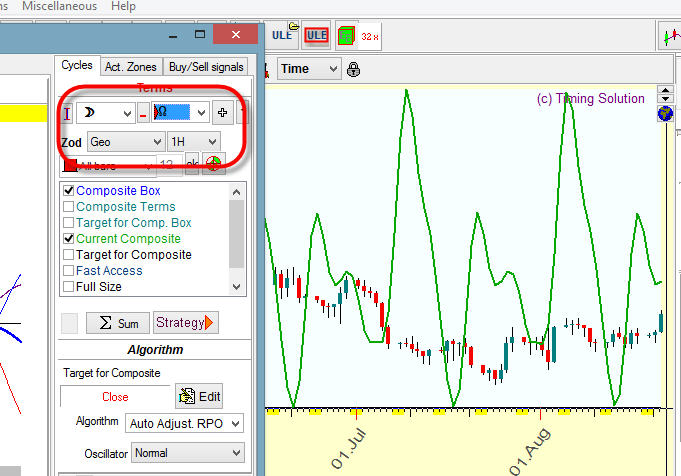
Mercury phase (Mercury-Sun HELIO, Sun in helio means Earth so this is Mercury-Earth helio cycle):
Venus phase (Venus-Earth helio) cycle (often works for currencies):
Jupiter cycle Try it for long term data. This cycle is close to the classical Juglar cycle, here it is:
You can try other cycles as well, using different planetary combinations and Zodiacs; remember only that the cycles above are the most important ones. For example, the Moon draconic cycle is important for silver price. (Draconic cycle represents the Moon movement in respect to the North Node.) This is the composite for the Moon Draconic cycle:
Why is this cycle important? You see three different composite curves on the diagram above: red, purple and blue. They point approximately at the same price movement. Each composite curve was calculated for a different time interval. As these curves point at the same direction, we may expect that this cycle should work for a while in the future. This is "split criteria", it is explained here: http://www.timingsolution.com/TS/Study/Classes/class_comp_2.htm
So you should to check different planetary combinations observing the consonance of different composite curves. If you see that all composites based on the same planetary combination though calculated for different time intervals show different direction of the price movement, it means that this cycle simply does not work for your price data set..
Predictable zones
Pay attention to red stripes on the bottom part of the composite chart, like on the picture below (this is Draconic cycle calculated for gold prices):
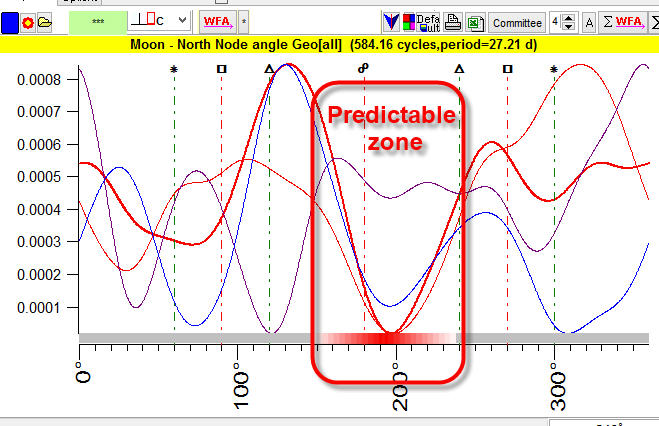
These are predictable zones. In this composite diagram there is only one predictable zone: the period when the angle between the Moon and the North Node varies in a range of 160-230 degrees. Within this period, this cycle works approximately in the same manner, while beyond it this cycle is not certain, we cannot trust it.
The idea of this module is very simple: the program calculates a periodogram to reveal the strongest cycles within the analyzed data. Peaks on this diagram correspond to the strongest cycles:
After that you can drag and drop these cycles on the Main screen to get a projection line based on these cycles:
Actually the program can perform these procedures automatically (like in Turbo Cycles module). However, it is better to perform them manually because you may miss some important hidden information that lies behind these cycles. Usually there are several cycles, all of them are strong, and we need to decide what cycles to pick up - one of them (the strongest), a combination or all.
What kind of information is it? Look at the periods of these cycles:
One of them, the cycle with the period of 116.54 days, is very close to 116 days' Mercury phase cycle; this is a good additional confirmation that this cycle is important.
Below is the list of cycles that are most typical for different financial instruments:
38-42 months Kitchen economical cycle
116 days - Mercury phase cycle
564 days - Venus phase cycles
around 2 years cycle - it looks like this cycle is tied with Mars cycle, like Mars-Saturn cycle
55 and 270 days cycles - I don't know the nature of these cycles
It is a good practice to pay attention to these cycles always.
You may apply a wavelet technology as well to reveal dominant cycles: http://www.timingsolution.com/TS/Study/Classes/wavelet.htm
5) Step #6 When you have not enough price history
Variant 1
If you do not have enough price history data to calculate some astro cycle, there is still something that you can do.
In the example below I have downloaded three years of price history data. and we try to calculate Annual cycle variations for these data. (I would prefer to have more data, 3 years is actually not enough, I would prefer 10 - 12 years of data for the proper analysis.) In Composite module, open tab "Act. Zones" and set there the amount of splits to 100:
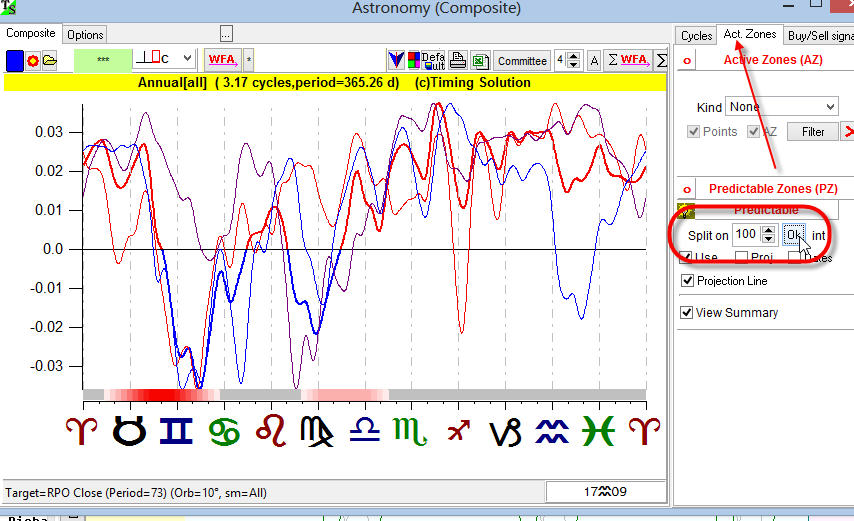
In this case, these three split lines of the Composite diagram show the price movement for each year. Pay attention to the moments when all three split diagrams show the same direction, i.e. specify the predictable zones:
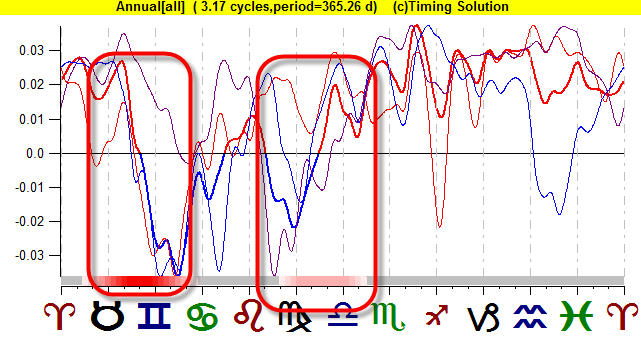
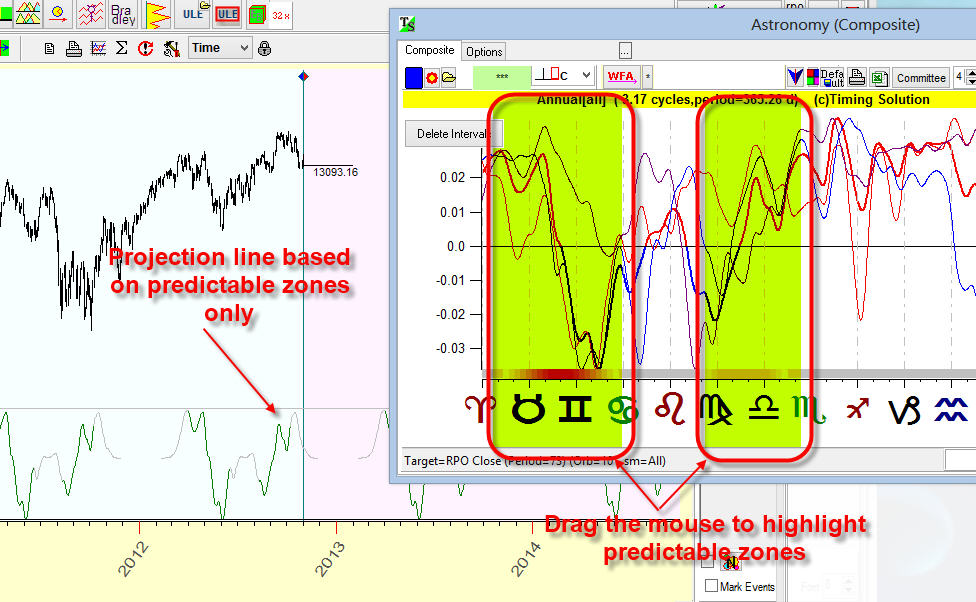
The presence of these predictable zones gives us some hope that the price will go in that same direction when the Sun is passing through those zones. As you see on the diagram, the predictable zones for this financial instrument appear when the Sun passes Taurus-Gemini and Virgo-Libra.
Dragging the mouse over the composite diagram, you can highlight these predictable zones; the program will recalculate the projection line based on these predictable zones:
Variant 2
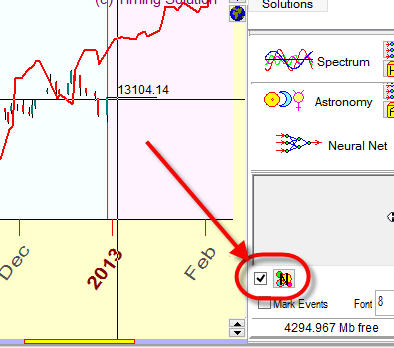
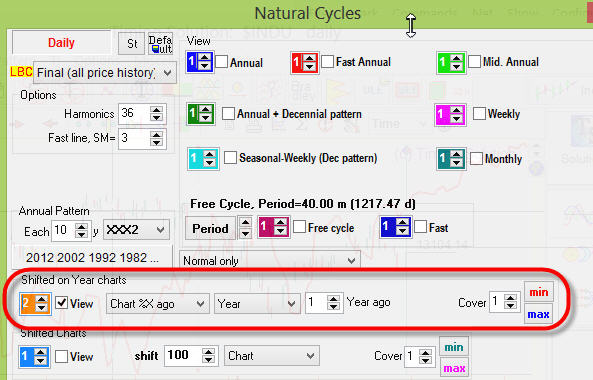
Another variant to work with short term price history is to use Natural
Cycles module. Set this option ON and click  button:
In this example I have downloaded 3 years of price history data. The goal is to get some idea regarding Annual effect for this financial instrument.
In Natural cycles module, uncheck all cycles, leave "Shifted on Year chart" cycle only:
You will see the price chart for 2012 (written January 1, 2013):
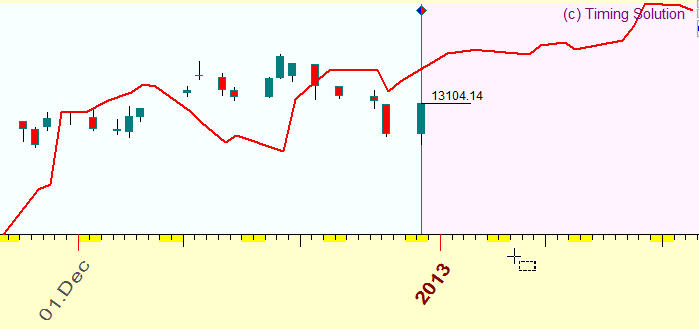
The red line represents here the shifted price chart that shows the price movement in January 2012.
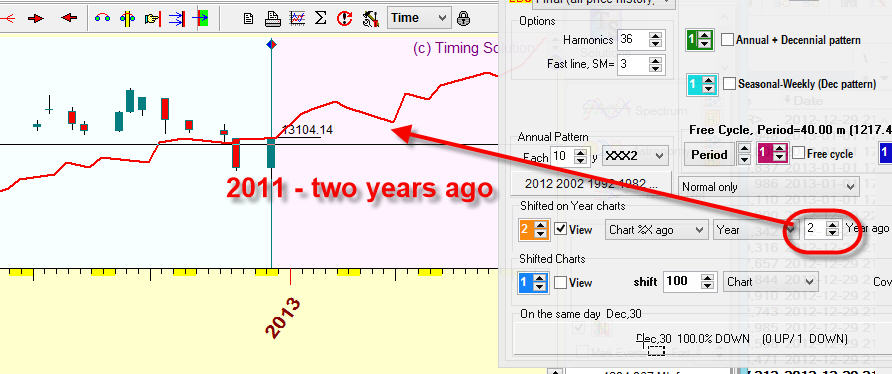
You may set shift to 2, and you will see the price chart two years ago, i.e. you will see the price chart for January 2011:
The same way you can watch the price chart three years ago, here it is:
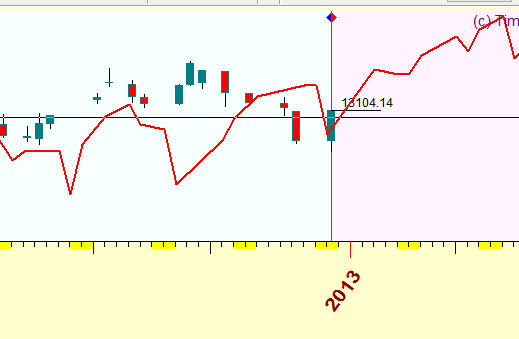
Thus you will get some glue regarding price movement in January 2013 (in this example), through this analysis is not full. But if you have not enough price history there are not another way.
6) Step #7: Charting Tools
I think this is the most used part of Timing Solution software. However, it is very difficult for me to specify what charting tools are more/less important.
I recommend to read first this article regarding these techniques: http://www.timingsolution.com/TS/Study/ts_charting_tools/index.htm
Try Advanced and Astro Based charting tools. You can easily find Andrew's pitchfork, Fibonacci ellipses practically in any charting software, while Advanced and Astro Based charting tools are presented in Timing Solution only.
More advanced approach
When you get more comfortable with Timing Solution you may try more advanced techniques.
This module generates the projection line based on dominant cycles. This is
how the output of this module looks like:
It displays the period of dominant cycles and the projection line based on them. I recommend to run two (at least) Turbo Cycles modules and run them with different SM2 parameters:
Here I run two Turbo Cycles modules with SM2=1 and SM2=5. The first (red) project line reflects latest tendencies while the second (blue) line reflect more long term factors:
You can disable/enable any of these cycles or use your own cycle.
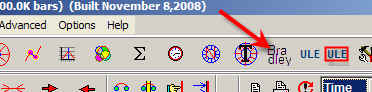
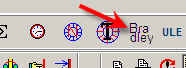
Bradley siderograph is a very simple and effective forecasting model. You can run it here:
I would recommend to apply it together with the committee technique. I will show you how to do that.
This technology is described here: http://www.timingsolution.com/TS/Mini/12/index.htm#2
These are step by step procedures to obtain Bradley committee (just pictures):
a) run Bradley module:
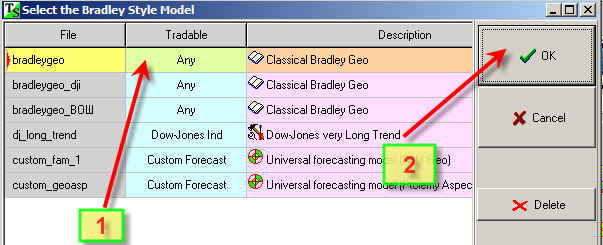
b) download Classical model:
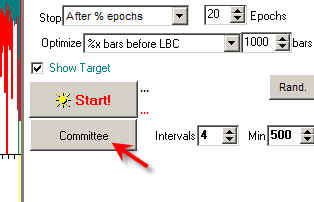
c) open "Optimization panel":
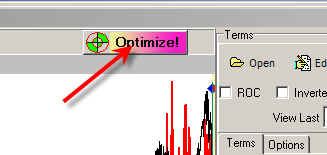
d) calculate committee:
e) all projection lines are in the Main screen now:
This module allows to reveal support/resistance levels from the statistical point of view. Clicking this button:
 you will get this
colored diagram:
you will get this
colored diagram:
Read this diagram this way: if August 28, 2009 is a TOP turning point
(9630.20), the red stripes on this diagram represent the most probable levels
for the next BOTTOM turning point.
From the other side, if August 28, 2009 is not a turning point yet, set the
"Force" option OFF:
And the program will display the resistance levels for the most probable TOP turning point:
The program calculates these high probability zones analyzing zigzag proportions, so if the price history is not enough to provide the statistical analysis, we recommend to decrease the critical zigzag swing:
For Forex and commodity traders
For Forex and commodity traders we recommend to apply both Annual and Venus phase cycles. To calculate Venus phase cycle in "Astronomy" module set these options:
Also the Moon based projection line is recommended. We recommend employ projection line based on Moon phases (Moon-Sun angle separation geocentric):
and Moon Draconic cycle (Moon-North Node angle separation):
You can also apply this approach, to find the best Moon based projection line: http://www.timingsolution.com/TS/Articles/moon_model/
Annual +Similarity divergence strategy. We recommend to employ Annual+Similarity strategy for financial instruments that follow Annual cycle (most indexes, stocks, some commodities). This strategy is very simple:
- calculate Annual cycle;
- run Similarity module;
- and watch both projection lines. This is a sample:
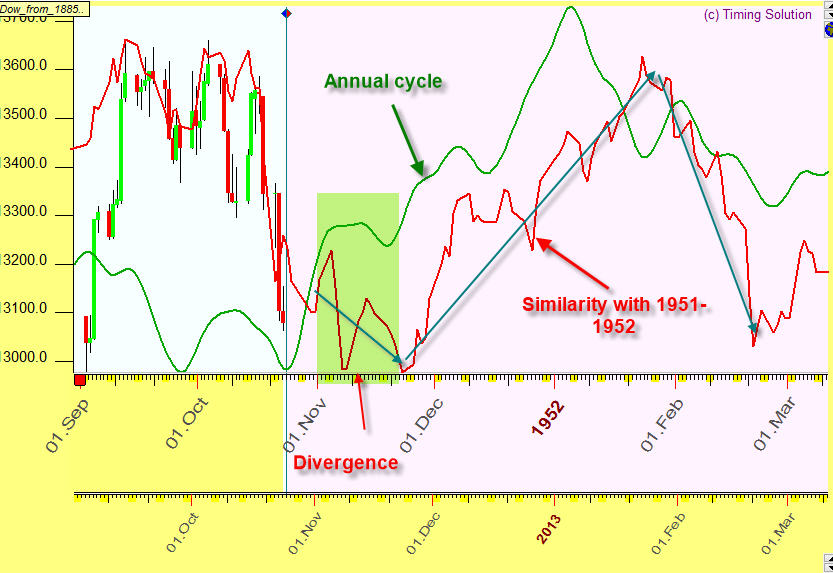
As you see on this picture, Annual and Similarity modules provide different projection lines. November 2012 is a divergence between these projection lines.
In this situation we recommend watching both projection lines - Annual and Similarities, to recognize as early as possible the scenario that might be chosen by the stock market. The underlying idea is very simple here: "if the stock market does not follow classical Annual pattern, it means that something has happened; and we are looking for analogies in the past with Similarity module".
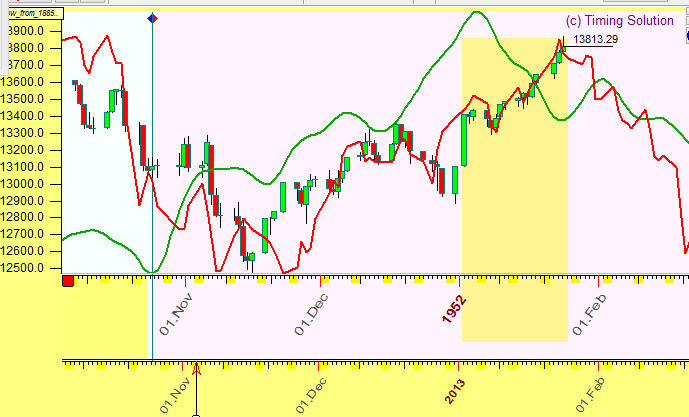
In this particular case Similarity model works better; January 2013 comes without any correction which is confirmed by Similarity module though is not confirmed by the Annual cycle:
In Similarity module, we recommend to try both options - "No Filter" and "Similar Year":
November 22, 2008 - Updated August 31, 2009 - Updated May, 2011 - Updated February, 2012 - Updated July, 2012 - Updated December, 2012 - Updated January, 2013
Sergey Tarassov
Toronto, Canada