Astro Metric charting tools in Timing Solution
written by Sergey Tarasov on March 5, 2016
In this short article I want to show you four charting tools available in Timing Solution software. All these techniques are based on astro metrics. It means that here we measure a distance between important points on the price chart using not trading days, not calendar days but using some astro based measure. As an example, we may calculate how many degrees the Sun has traveled between important turning points on the price chart. Or we can calculate the increments of the angle separation between the Sun and Mars.
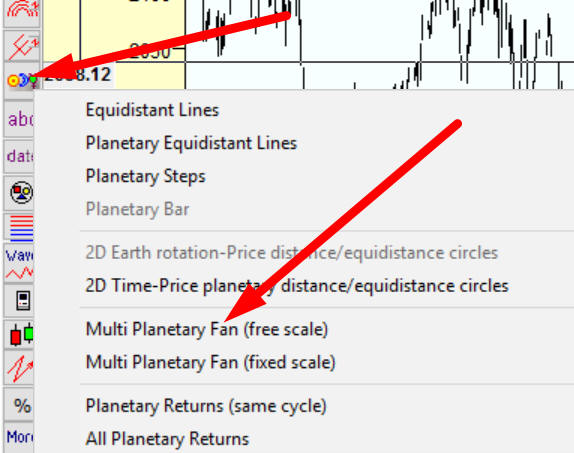
Multi Planetary Fan (free scale) charting tool, this tool is here:
This charting tool works pretty much the same as classical Gann fans charting tool. But instead of stretch lines, we use here planetary positions, so the lines below show the movement of four planets in heliocentric system - Mercury, Venus, Earth (Sun) and Mars:
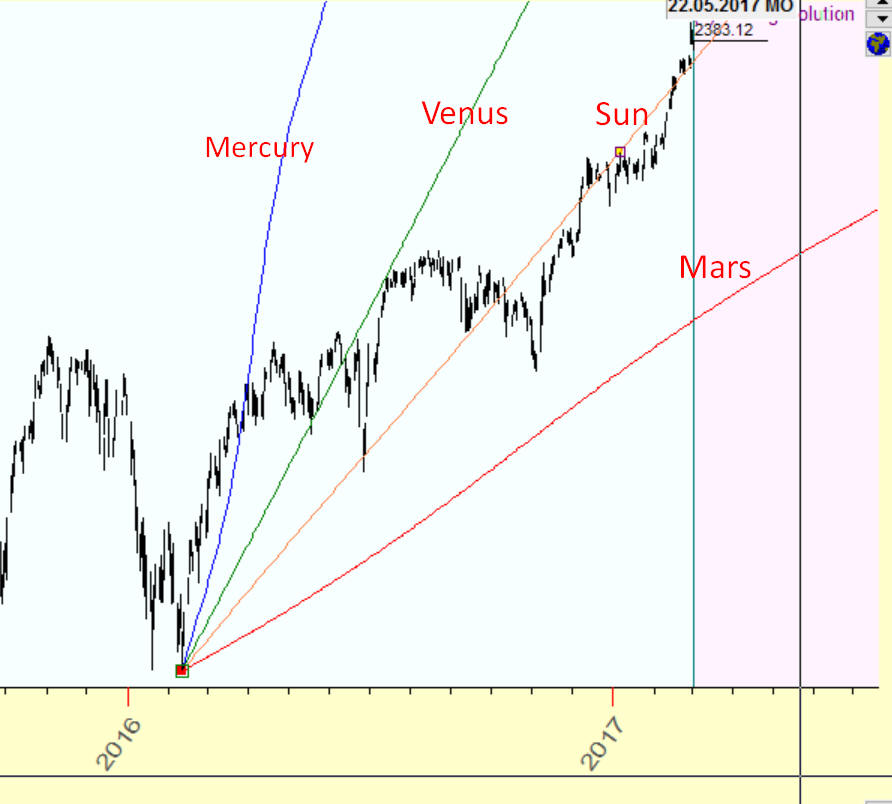
Maybe, planetary fans can be interpreted this way. Very often the trend is forming in three stages (at least): fast Mercury fan (because Mercury is the fastest planet), after that Venus and Earth stages. Mercury shows the beginning of a trend, some fast developing ideas. After that more slow planets dress these ideas in material forms.
Planetary Equidistant Lines charting tool, this tool is here:
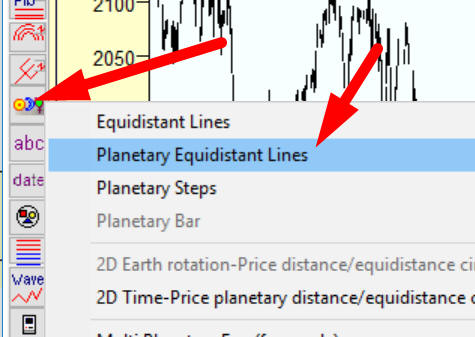
The price chart below shows the core idea of planetary equidistant lines charting tool:
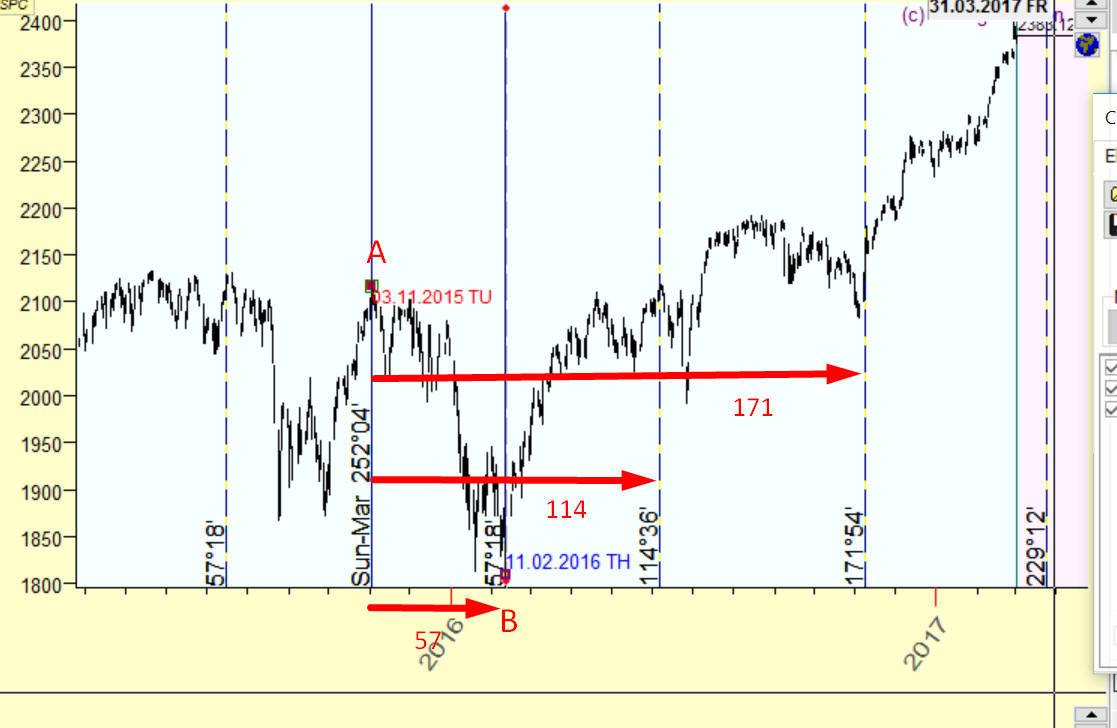
We analyze two turning points: TOP November 3, 2015 and BOTTOM February 11, 2016. We calculate how the angle separation between two planets, Earth and Mars in helio, changes. Within this period (about three months) this angle has increased on 57 degrees. Now we prolong this 57 degrees interval into the future. You see as 114 degrees increment takes place at the beginning of June 2016 (local TOP). A new step, 171 degrees, is at the beginning of November 2016 (BOTTOM). Etc., we can prolong these lines into the future (and into the past) for as long as we need.
You can apply here any planetary combinations and angles, geo and helio Zodiacs. For example, this chart shows 7 degrees 30 minutes Jupiter steps starting from BOTTOM February 11, 2016:
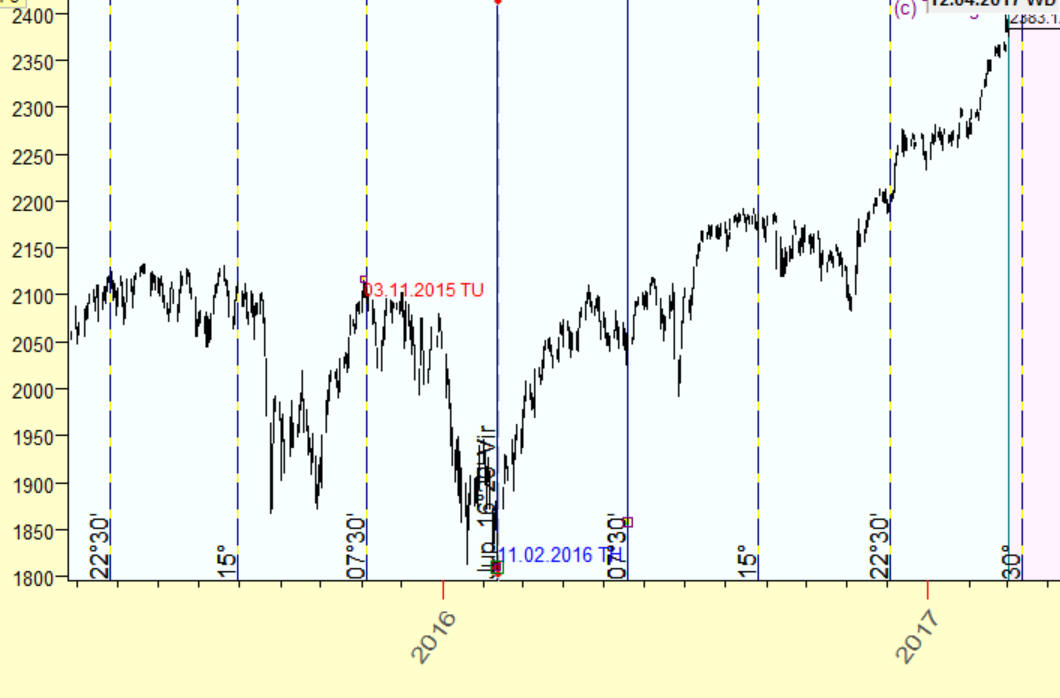
In other words ,these lines represent the idea "when Jupiter in helio travels 7.30, 15, 22.30, 30 etc. degrees, something important happens...".
We even can apply heavy mathematics to hunt the most promising angle increment. Look at this spectral analysis that shows that Jupiter helio 19deg18min cycle is strong (peak):
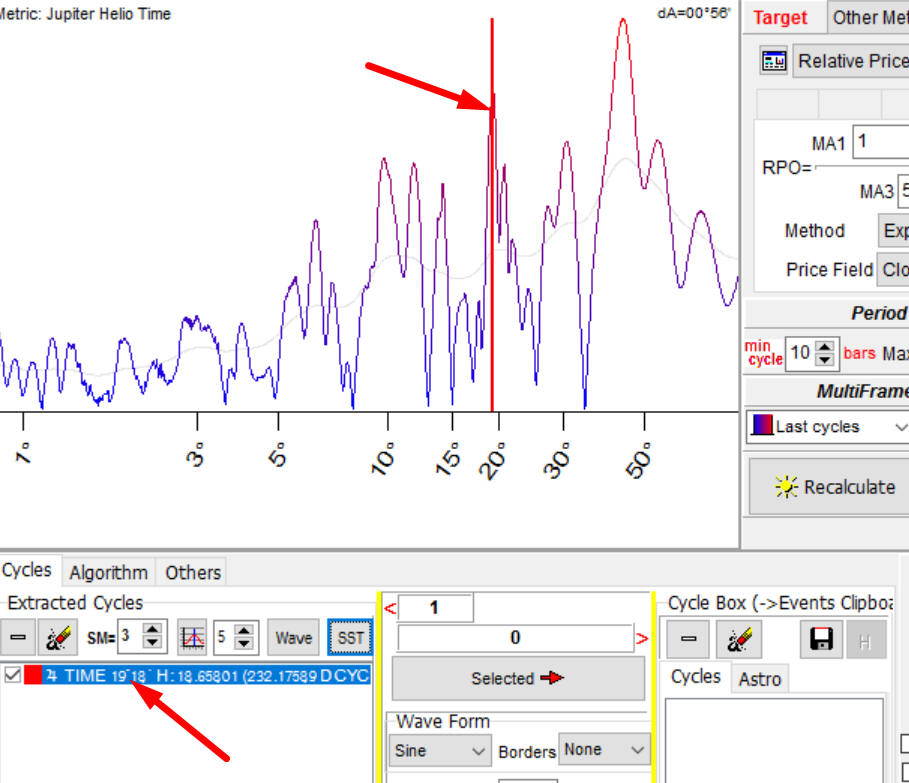
Now we can use this 19deg18min increment in charting tools. This is how this increment works:
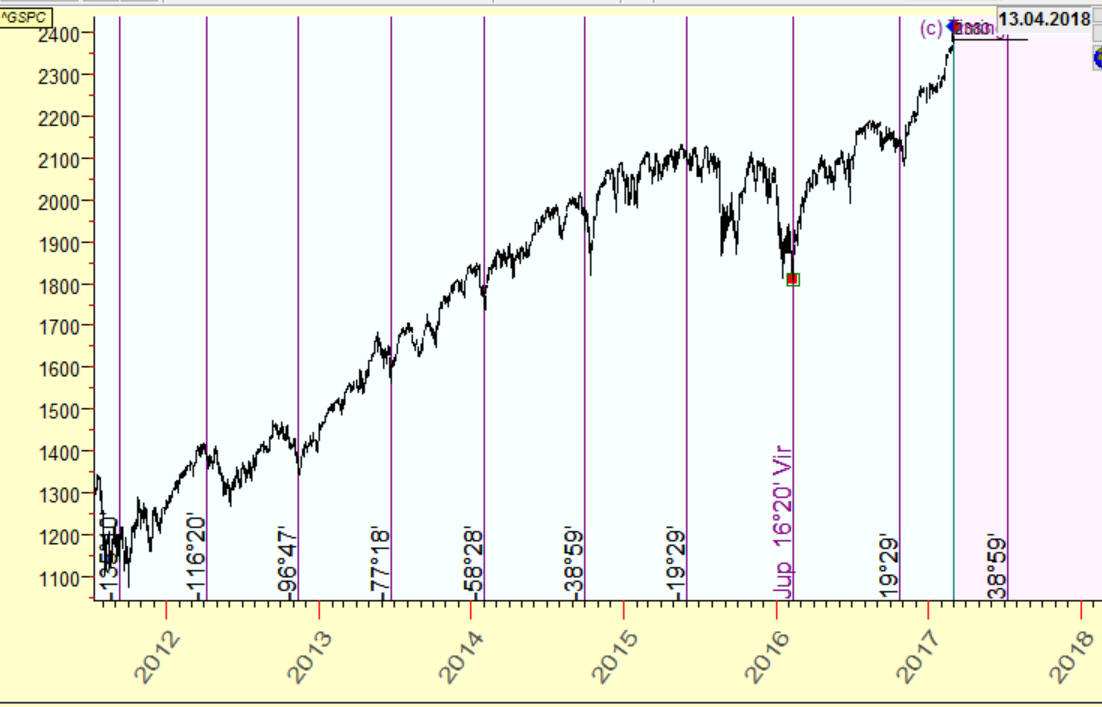
Of course it does not catch all turning points, though it catches maximum of them for this astro cycle.
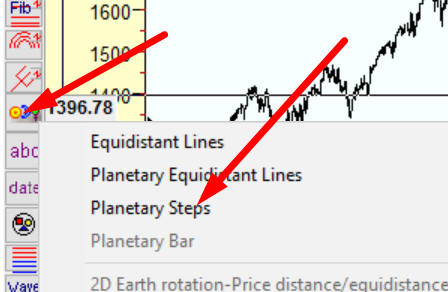
Planetary Steps charting tool, this tool is here:
Using planetary steps charting tool, we can build pretty sophisticated models. For example, look at these lines based on the Moon tropical cycle and Fibonacci numbers:
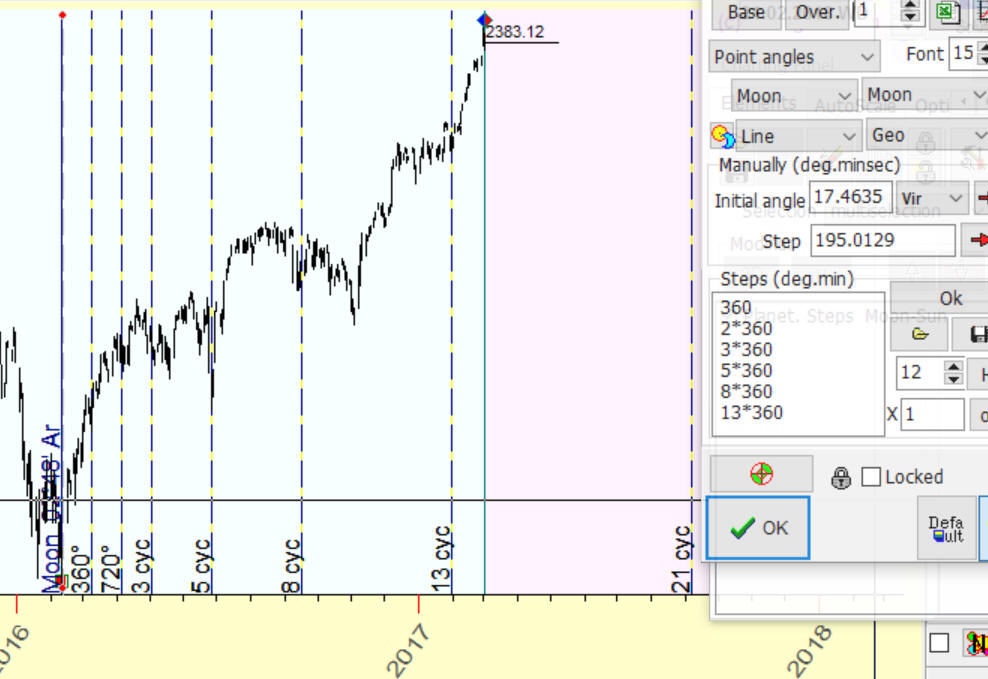
At February 11, 2016 the Moon was in Aries. We build a next line when the Moon passes Aries the next time, which happens in 27 days:
i.e. 1 Moon cycle
next line 2 Moon cycles
next line 3 Moon cycles
next line 5 Moon cycles
next line 8 Moon cycles
next line 13 Moon cycles
next line 21 Moon cycles
etc.
You can play with different planetary combinations and digit sets.
All these techniques are explained in this class:
http://www.timingsolution.com/TS/Study/ts_charting_tools/index.htm#A5
see "Astro based charting tools" there.
There are also a lot of additional educational articles regarding this subject because these modules are the most used by users.
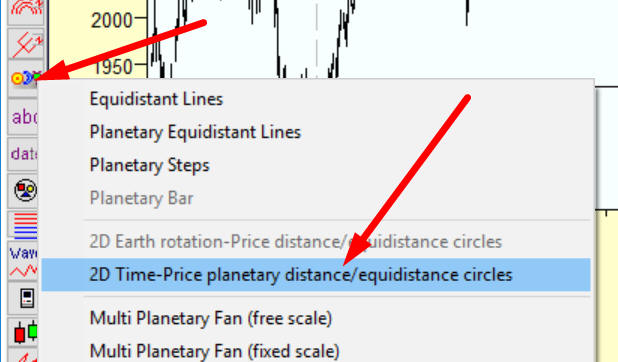
2D Time-Price planetary equidistance cycles charting tool, this tool is here:
This is a pretty advanced technology that involves advanced math as well. Generally, this module incorporates an idea of scaling the price chart, the difference is that for scaling this chart we use astro cycles (instead of time).
Look at these cycles that remind me isothermal lines:
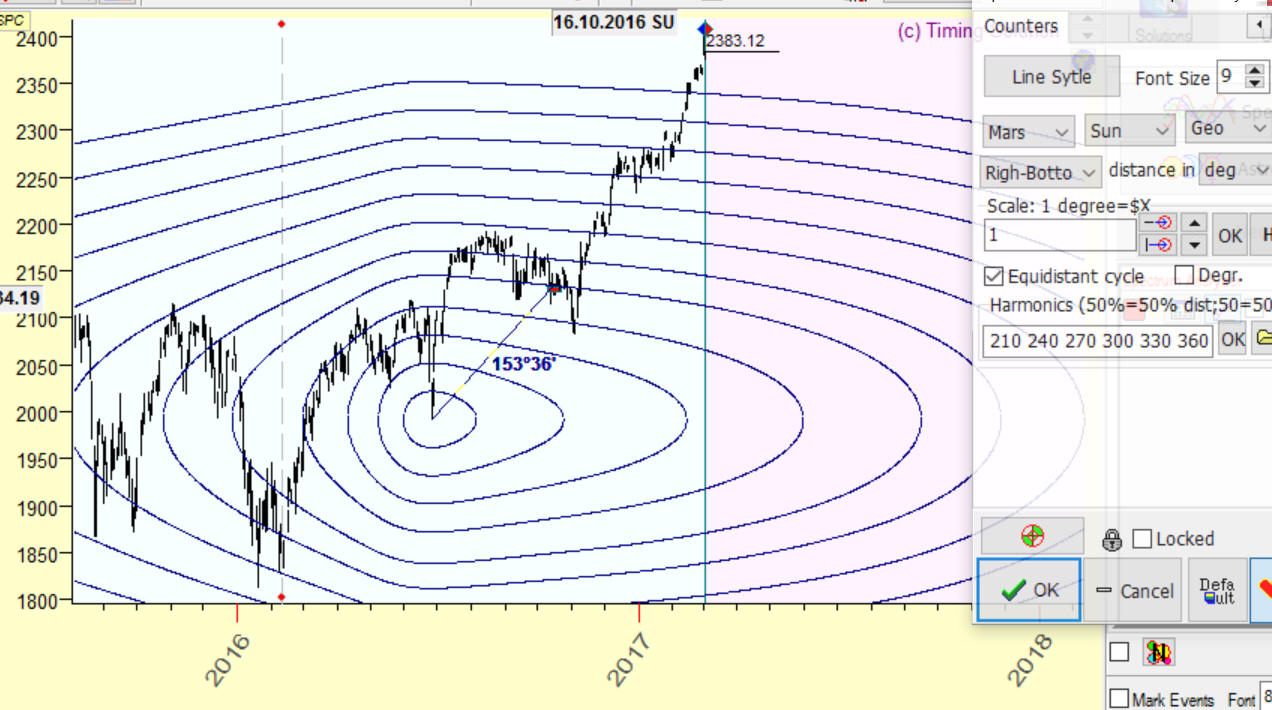
These cycles with the center at BOTTOM June 27, 2016 represent 30, 60, 90, 120 ... 360 degrees cycles. As a scaling angle, we use the angle separation between the San and Mars geo. Also we use price/time ratio $1 of price movement equal to 1 degree of Sun-Mars geo increment. Thus we can calculate a distance between two price/time points on our price chart and accordingly calculate equidistant cycles.
You can read about this technique here:
http://www.timingsolution.com/TS/Articles/ptd/
http://www.timingsolution.com/TS/Mini/52/index.htm
I tried to do an elementary mathematical explanation for this approach here:
http://www.timingsolution.com/TS/Articles/2D_Scaling/