Timing Solution: Easy Start
written by Sergey Tarassov
Timing
Solution software is designed to produce the forecast for future price movement.
We can make forecast for a week ahead, a month ahead; there are models as well
that can describe
in general the price movement for one year ahead. This is a major difference between
Timing Solution and technical analysis software that concentrates on finding
enter/exit points. Our main goal is the projection line.
To get this projection line, we have developed our own state of the art math
techniques (it
is impossible to find them anywhere else). The unique feature of this technology
is that it has been developed purposely for
existing financial data, not for abstract data. It took us years to recognize
the restrictions of common used Neural Networks and create the specialized Object
Oriented Neural Network that deals with financial information much better. The
difference between common Neural Network and our specialized one is similar to
shoes taken from some stranger (they may fit you, though most often they are
not) and shoes made by the shoemaker especially for you. A good shoemaker will
explore your feet attentively, choose proper materials, and make the best cut.
Everything will be taken into account, even the color and places where to wear
those shoes...We do customized models for different financial instruments. We
have specialized modules in the program that allow to
find regular cycles in stock market (Multiframe Spectrum), and
astronomical cycles as well. Several computers in different parts of the world are working all
day
along looking for the best projection lines for stocks and futures, indices and
currency pairs. Every finding makes our final product - the projection line -
more and more accurate. We provide
real, true, statistically verified Back Testing for all our models.
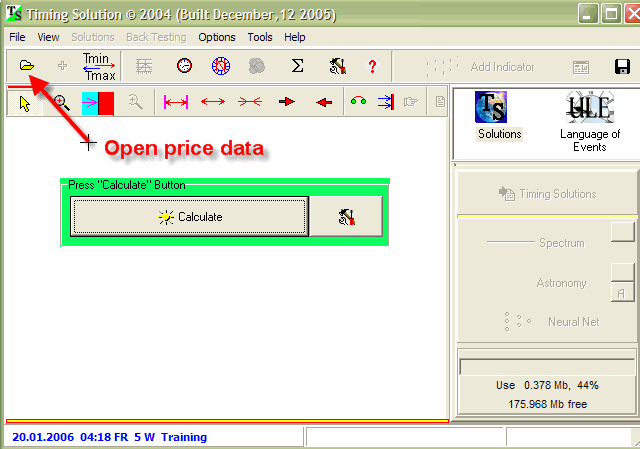
When you buy the program and run it first time, you will get this window:
Our goal is to create forecast. What we need to start is the price history for a financial instrument that has to be forecasted. The data must be taken from some other source. You can store these data in a text format, Metastock format or CSI format. If you have data available in one of these formats, you are ready to make a forecast.
Click on the left top button as shown at the picture above. You will get this window that allows to read price data:
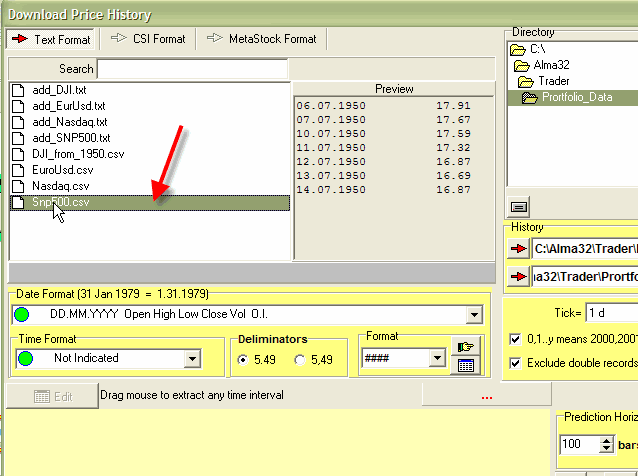
This is a very smart window. It can read about 400 different text format. Moreover, the program itself finds the most appropriate format for the chosen price data file automatically. In most cases, we just choose the file, and the price chart is shown on the screen:
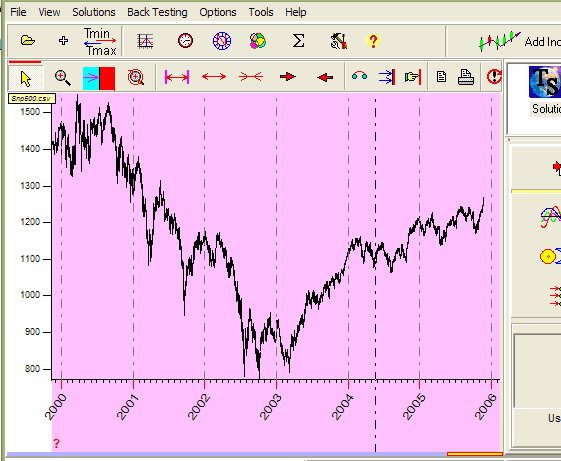
You can do with this chart whatever you want - zoom, shift,
choose a part of the whole picture, etc. If you do not know how to do this, look
at the documentation: ![]()
Before doing any operations with Timing Solution do not forget to click the "Calculate" button after downloading the price history data:
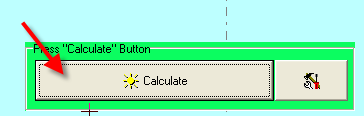
Once the price chart is downloaded, we are ready to make a forecast.
Easy made Forecast - Timing Solutions module
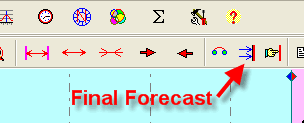
The program is able to work in one of the two regimes: Back Testing regime and Final Forecast regime. The Back Testing regime is designed for checking the suggested models on historical data. It means that we use a part of available data to check the model's forecasting abilities. Final Forecast regime uses all available data to make a forecast.
Let us make Final Forecast together. In other words, we do the forecast using all available price points. Clicking on this button, you tell the program your intention to make the Final Forecast:
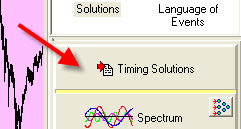
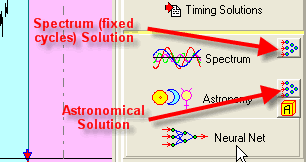
Now comes the most interesting part: we ask the program to provide the forecast automatically. Click here:
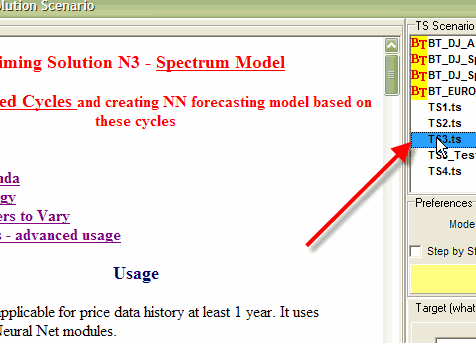
You will get the list of prepared Solutions that you may apply to your financial instrument. Some Solutions are adjusted for specified financial instruments. Please read all the comments carefully.
Let us choose one of the Solutions, the Solution that works with the model based on fixed cycles:
In a minute the program will perform a huge number of calculations and provides us the ready Neural Net projection line based on fixed cycles (that present inside the data time span):
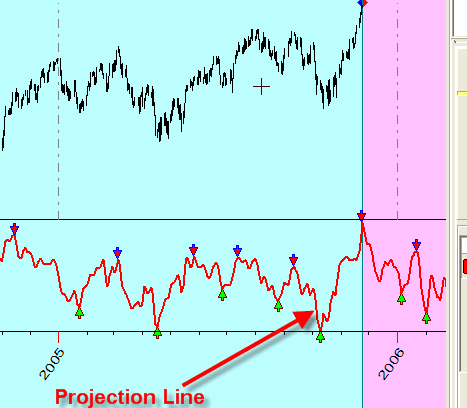
This line can be prolonged into the future (this article is written on December 12, 2005, and the forecast is made at that time). You may choose and create the astronomy based model, auto regression model and others. We work constantly checking the old models and preparing new Back Tested models for different financial instruments. As an example, see below the Back Tested model provided by Timing Solution friend, Mr. Ben Price.
What did you do? A very important thing - you made a choice of the Solution. If you would like to do this projection line on your own, how many things you should know? Here are just some of them: Spectrum analysis, Neural Net technology, Nonlinear Dynamics, basics of Wavelet analysis (these are from the Math side). Add to the list Technical Analysis basics. Plus - some models use parameters that are common in Astronomy, while several models apply basics of Astrology. You may spend years preparing yourself for this type of forecast. Timing Solution saves your time and efforts as we program all these techniques, create models as their applications, and adjust them for real financial data. With all suggested Solutions, you can get a forecast by several mouse clicks only.
Ready Solutions are a good thing. They give you a hint of a possible price movement of your stock, or futures, or index. But - there are no universal receipts in making a forecast. Each financial instrument has its own peculiarities, and from time to time it may not to follow the average path. For that reason, we always suggest to check several different models (at least, three) that are related to your financial instrument. Timing Solution software provides the wide range of possibilities to play with different models. It helps to get the forecast that is closer to the reality.
As a first step to get acquainted with this variety, I would recommend to use Fast Solution buttons:
Here you can vary the parameters of analyzed models. It is called in the program as "Timing Solution Styles". There are three standard styles:
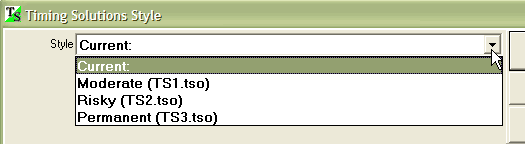
The process of finding the best models to create a projection line looks like finding a right path in the forest. It is easy to get lost there. Three standard Styles represent the paths that cross this huge forest. There are three main paths here - Permanent, Moderate and Risky. "Permanent" style deals with cycles that proved previously their importance (like the most used path in the forest or the yellow brick road), while "Risky" style allows to deal with not so well proved cycles (risky paths in the forest go through open lanes and dark places, so sometimes you should be very cautious and ready to run any moment). "Moderate" style/path is something between the two. Generally speaking, the styles provide us with the guidelines in creating a forecasting and defining the playing parameters.
Sometimes three projection lines provided by different models are still not enough to reach our goal (which is a reliable forecast). In this case, you might to choose using the smaller roads that direct you to the nearest turning point (in other words, show your way to your profit). If it is the case, you may try to adjust the parameters for the analyzed models. For example, these are the parameters for astronomy based models that may worth to play with:
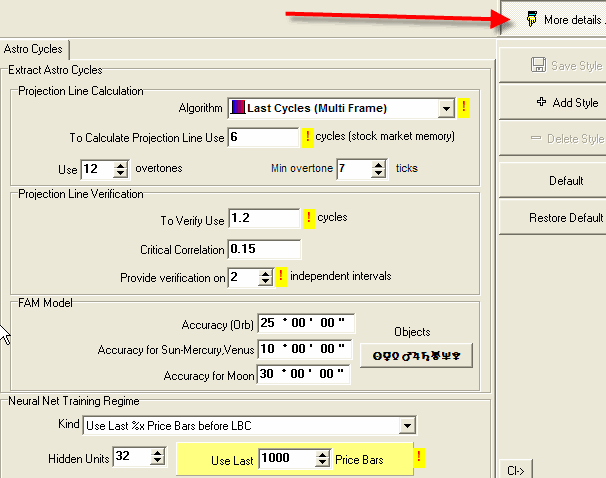
The most important parameters are marked by the exclamation point. Their importance for the quality of the projection line is proved by extended Back Testing of the model. You can compare these parameters to warning signs on small roads in the forest.
Back Testing of the models is really important. It gives us an access to the bigger picture. Back Testing is the best tool in finding the best forecasting ways for different financial instruments. The examples of Back Testing reports for some models are here. Downloading free Timing Solution upgrades, you get the access to these statistically verified models.
As so far, to get a forecast in an easy way, you basically need to do just a few things:
download the data regarding the stock/futures/index you would like to forecast;
choose the Solution;
get the forecast.
If you would like to do something else, to change some parameters, you may choose the Style as well.
All the above was regarding ready Solutions. As I have said already, it means that somebody else has done the job of changing parameters, creating the models and Back Testing these models. Even if you choose to go in depth and work with Styles, you still will be able to play with parameters inside the suggested models.
Of course, you can do all the job yourself. All modules of Timing Solution software are at your service. You can read more about available techniques here. You will see yourself that even the above mentioned model based on fixed cycles has many variants that really improve its forecasting abilities (see here). Looking for the best models, exploring the parameters of these models, we have applied different math methods and developed some new techniques. One example: to predict turning points, we have developed the detrended zigzag that is much more suitable for Neural Net forecasting; see the info here. We constantly upgrade our software, every time when a new techniques comes. And Back Testing... It goes day and night, in different parts of the world; models and their parameters are tested as well as other important things. It helps us to put the road signs on the way of forecasting for different financial instruments (see here the info regarding Back Testing).
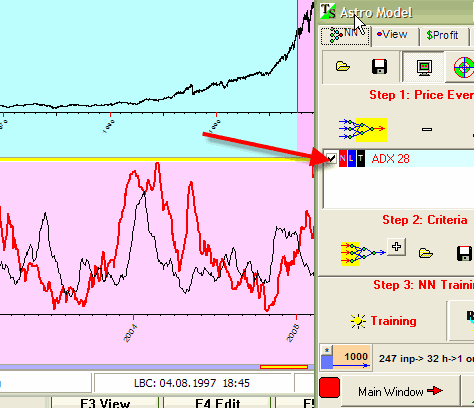
Now you can forecast such indicators like ADX, Volatility, RSI, and many others (this and following examples are made for S&P 500 index):
All important factors or phenomena can be easily visualized. See these four most important cycles extracted from Spectrum module of the program:

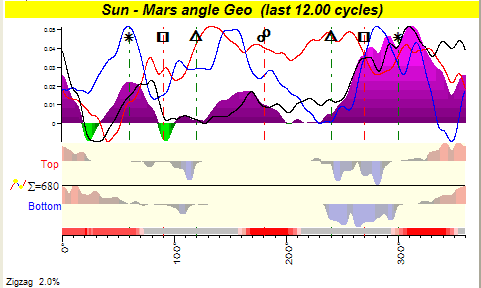
This is the sample of what can do the astronomical module of the program. It is a very powerful tool to reveal strong astronomical cycles:
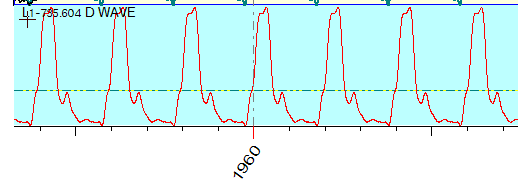
You can work with astronomical cycles like with any other cycles. See how this astronomical cycle works in time:
All modules of the program are designed to find or extract some kind of pattern or regularity in the market activity. Then this info goes into our specialized Neural Net. Neural Net works with this information and creates the model that is able to make a forecast. For more details on all major modules of the program, please see the materials on this website (see "Library" and "Research" info).
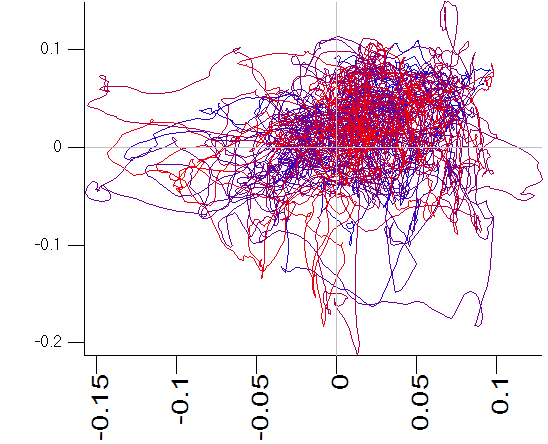
Finally, look at this sample of our research. These are results of the performance of the special model based on some ideas of Chaos Theory. If you will look at it in the multiplication mode (see details here), you will see the pulsation and the rhythm of the market:
So, when this easy start becomes really easy for you, you will find more fascinating opportunities and new steps in market forecasting.
December 10, 2005
Sergey Tarassov
Toronto, Canada