Forecast� July 15, 2013 - back into 1794 and astro sentiments
with update August 28, 2013
written by Sergey Tarassov
Click here for update August 28, 2013
Today is July 15, 2013. This is a very challenging time to forecast price movements when we have had seven months of uptrend movement with one correction in May. The cyclical analysis does not work here, as cycles that we can reveal there are not tradable, trend is stronger here than cycles (as an example, consider the most trustable Juglar/Jupiter cycle: we should face a significant downtrend movement two years ago, and we did not have it).
In this article I would like to show two techniques that are not based on cyclical analysis. It is still possible to do a forecast.
Looking at the analogy back in 1794
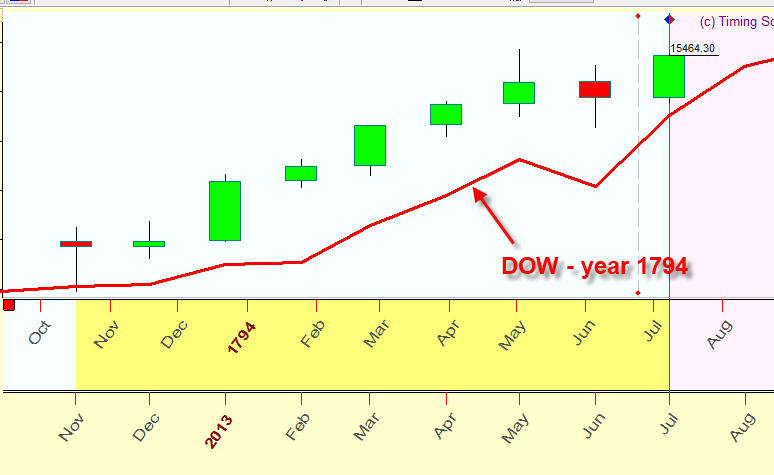
In our research we use the longest available price history data set for Dow Jones Industrial Index, monthly data since 1789. The data before 1885 represent a special interpolation based on archive materials; the info was developed by Bill Meridian and Foundation for the Study of Cycles. I always use this data set when modern price history does not help me much.
Let us ask ourselves: when in the past did we have 7 uptrend months with one correction month only, like we have now, in July 2013?:
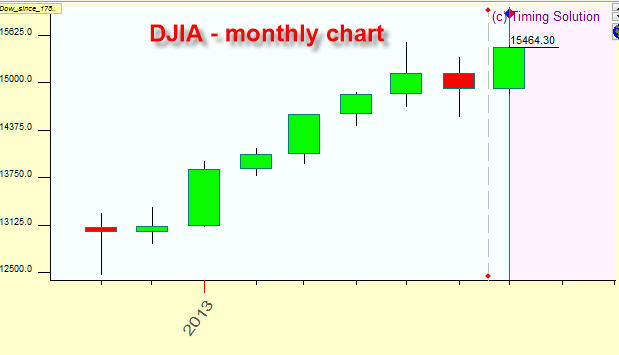
You will be surprised: during those 223 years when we either have documented Dow data or can extrapolate them, the similar situation has happened 3 times only..
Here they are, one by one. The first one has happened long time ago, in 1794. The red line below shows Dow changes in the years 1793-1794:
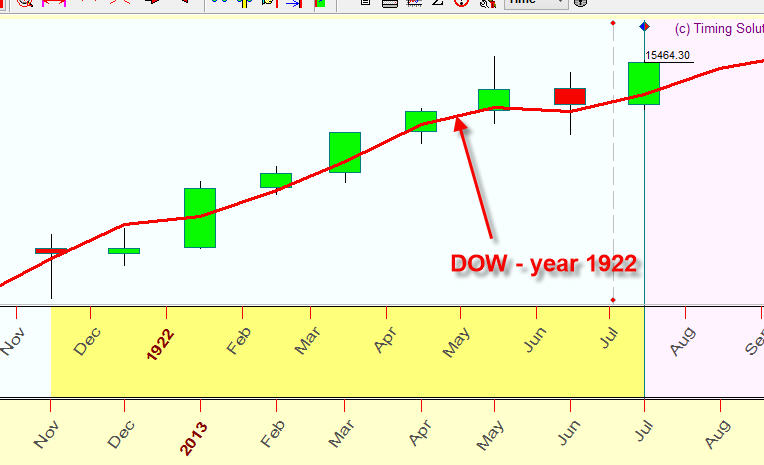
The next one is in 1922:
and the last one in 1964:
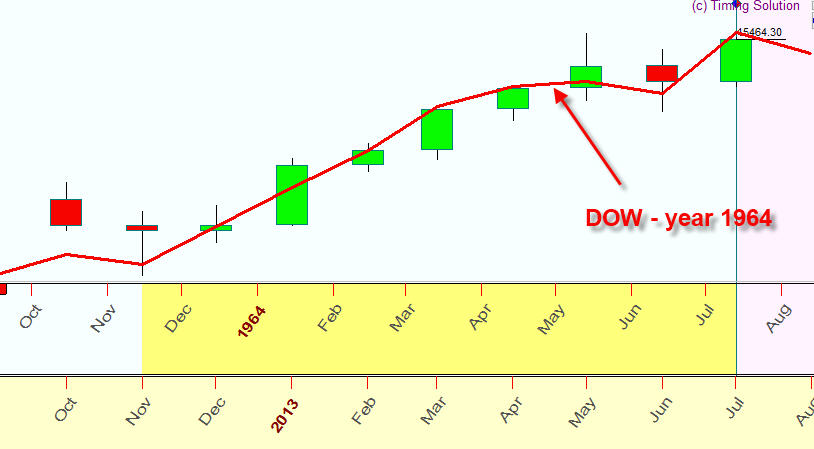
Pay attention to the price chart after July, i.e. price chart since July 1794, July 1922 and July 1964:
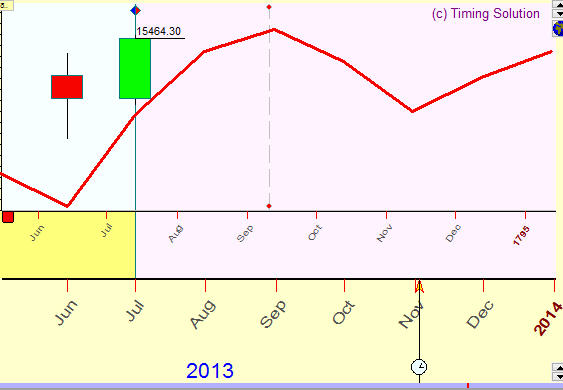
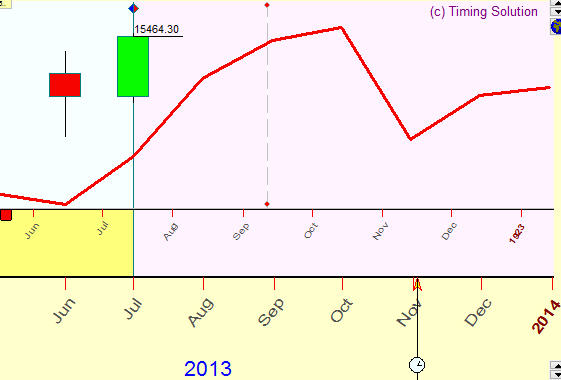
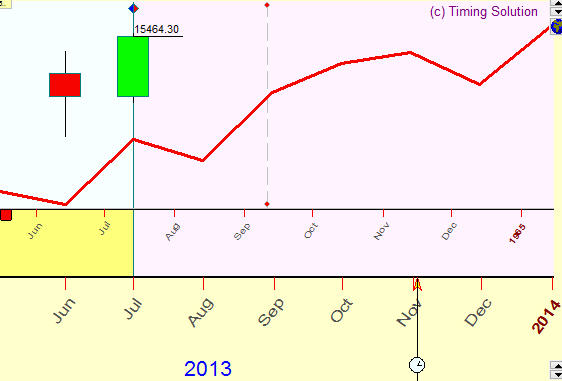
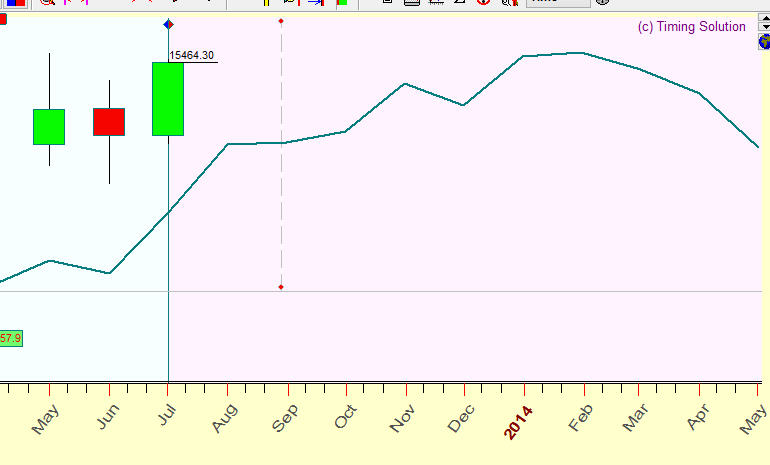
These patterns show uptrend movement till the next September-November, and it gives us some hope that this pattern may be repeated in this year, 2013. We can calculate a committee diagram based on these three charts, it can be used as a forecast tool: �
It looks like the stock marked still has a potential to rise, at least for this fall. �
Astro sentiment analysis
There is another approach to understanding what might happen to the stock market. It is a usage of some confidence indexes. These indexes are described here: http://www.sentimentrader.com/
I've analyzed one of them, Dumb money confident index. In brief, when this index is high (75% and higher), this is an alarm point; it indicates that the downtrend correction is coming. �The high value of Dumb Money index means optimistic mood among traders/investors who tend entering the stock market too late, and this is a sign of coming downtrend correction.
One of Timing Solution users showed me this index. I immediately recognized that indexes similar to those I have seen already - while constructing optimistic/pessimistic Neural Network models ( http://www.timingsolution.com/TS/Articles/waxwan/ ); the typical patterns look exactly the same. I have created right away this astro model and applied it for Dumb Money confident index. This is what I got (this is "out of sample" interval, and the coincidence between the black line (Dumb Money index) and the red line (Neural Network model for this index) means that our model really forecasts DM index):
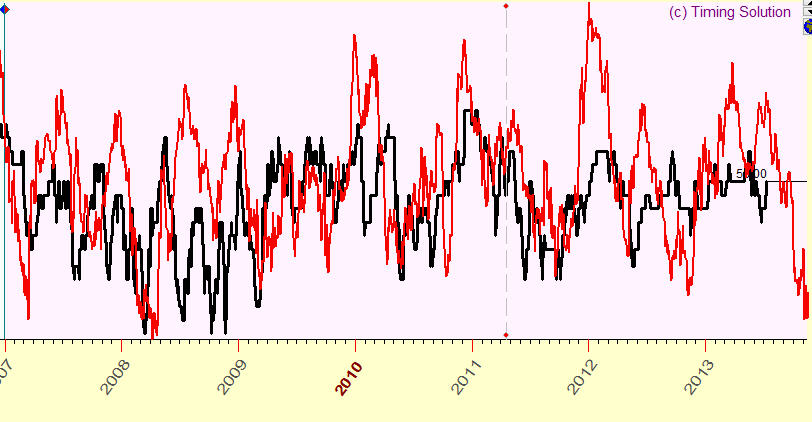
Here I used more advance "dynamic" model that provides more detailed forecast. For me it was a good surprise because the Dumb Money index that is used as a measure of optimistic expectations of traders who tend to enter the stock market too late and my research of optimistic/pessimistic indicator from astronomical point of view on the stock market meet together at this point. And a big plus is that the astronomy based index can be prolonged into the future, i.e. it can be used as a forecast tool.
The forecast of course is not ideal, however it reflects major tendencies, for sure. Correlation between DM index and Neural Network projection line for this index is 0.25 (on testing/out of sample interval), this is very good for astro based models.
Back to our forecast. Below is (look at the red curve) Neural Network forecast for Dumb Money confidence index:
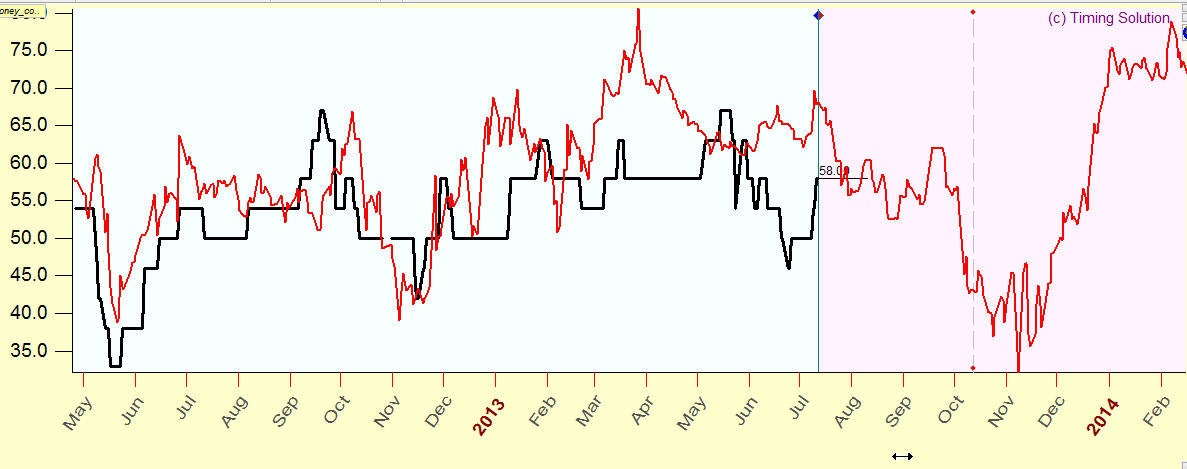
It looks like this index will not rise for the next three months, Dumb Money confident index will go down. It means that it does not look that "dump money" will now "kill" this current uptrend in the stock market. We will see ... �
Update July 17
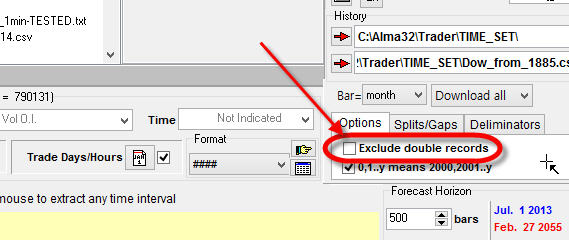
I have received many questions how to build the forecast model for dumb money confidence index (DM). So here you will find step-by-step explanation how to build this forecasting model. If you a subscriber of http://www.sentimentrader.com/ service, you may download the Excel file with this index since 1995. I also recommend to download the upgrade of Timing Solution dated July 17 at least, there are some small changes that allow to download this file more easy.
When you download this Excel file, do not forget to set "Exclude double records" to OFF, there are periods when value of DM does not change, we will use these periods in our calculations:
Now look at the chart for DM index. You see that this is an oscillator that varies in 0%-100% diapason. In other words, it can be considered as a non trend indicator, this oscillator values move around the average level of 50%.
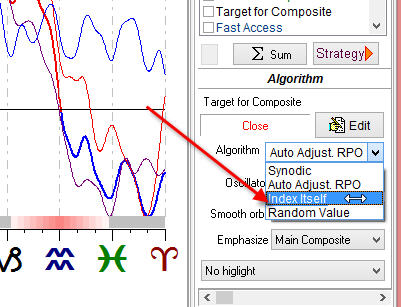
First let's calculate Annual cycle for DM. Run "Astronomy" module. Because we do not need to apply detrending procedure here, set "Index Itself" here:
Now let's find the astronomical model for DM index that involves other planets, not the Sun only. The best way to do that is to run "Terra Incognita" -> "Astro Expert" module.
I set these parameters there:
- set testing interval to 43% (it is better to have more than 10 years on training interval)
- set target to "Close", because we have no trend component
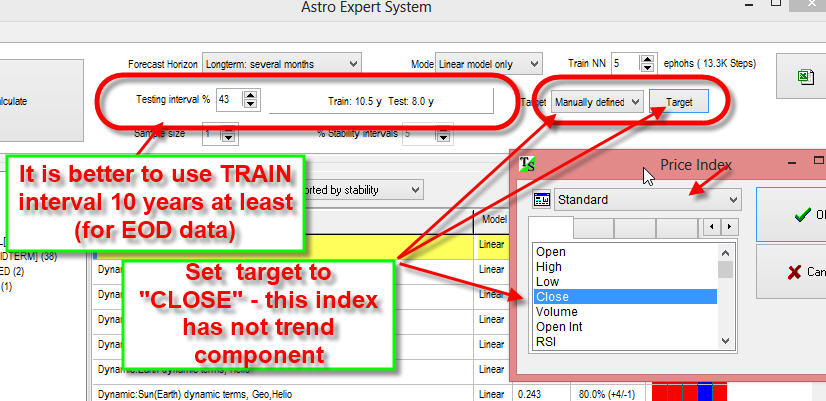
The program tried 132 models and displayed the most workable ones. After that I tried several best models following these steps:
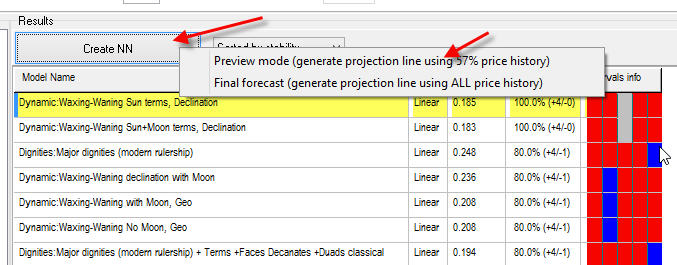
and watched how these models work on TESTING interval.
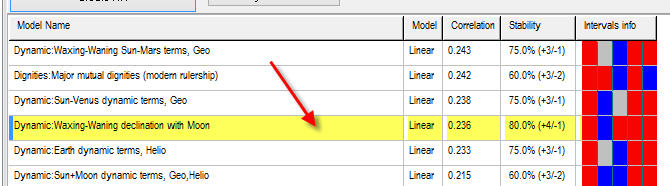
For me, this model (with declination) looks very promising:
after that I run this Neural Network in Final mode using ALL available
price history for optimization: ![]()
This is final forecast: green - Annual cycle, blue - Neural Network model:
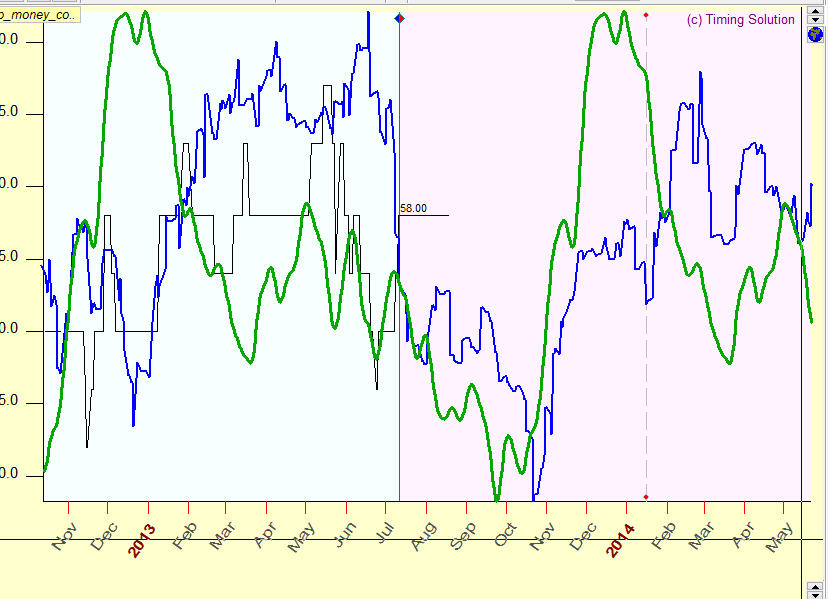
It looks like the uptrend that formed in November 2012 is over and it is possible that we are in a cyclical mode now. The movement of DJII within last 3 months is pretty cyclical:
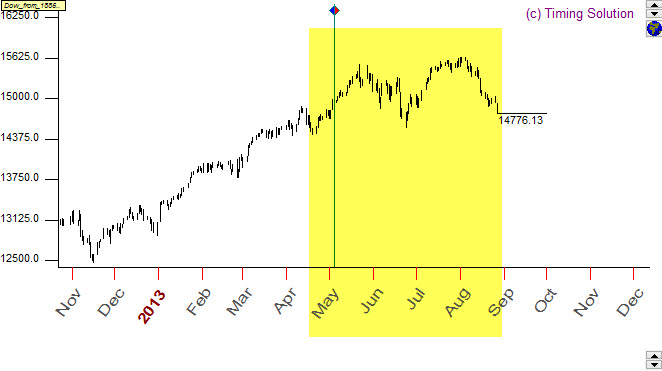
So, we can try to conduct the cyclical analysis to generate a projection line.
The first step that I recommend is simply look at the price chart. There you see a harmonic wave. Using Harmonic Wave charting tool, I can show it more clear:
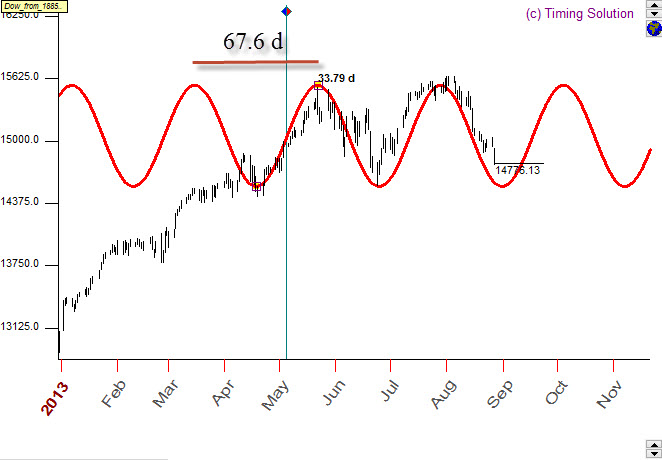
You see that this wave has a period of 67.6 days and it is active for the last 3 months already. However, I would not use this harmonic wave as a forecast tool. Let us take it just as an evidence that some cycle is there. To make a forecast, I prefer to start with the cycles that have some fundamental confirmation - astro based cycle.
First of all, let us look at the Annual cycle:
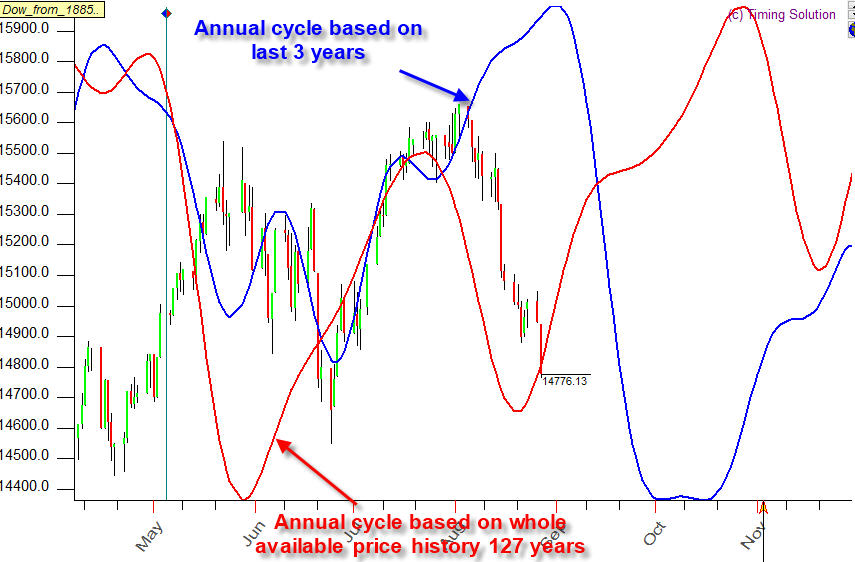
The picture above shows two Annual cycles: blue - based on all available price history for Dow, the averaged seasonal tendency for the last 127 years. Red line - Annual cycle based on the last three years of the available price history, it shows the latest tendency. We should keep in mind these two the most important cycles. The chart shows that we face here the "August drop", a seasonal phenomenon confirmed by the red curve and described here http://www.timingsolution.com/TS/Articles/August_drop/index.htm (this article has been written at the end of July 2012).
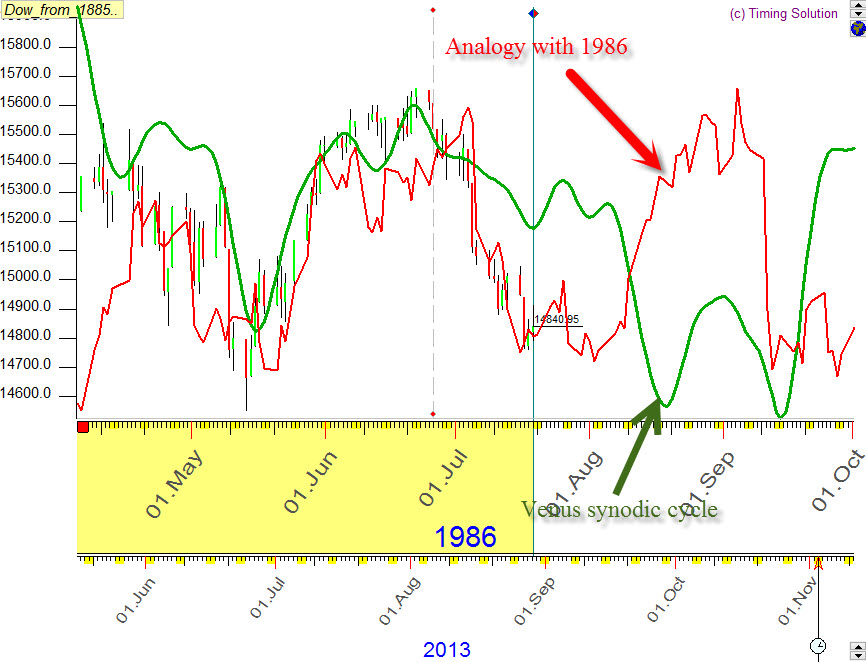
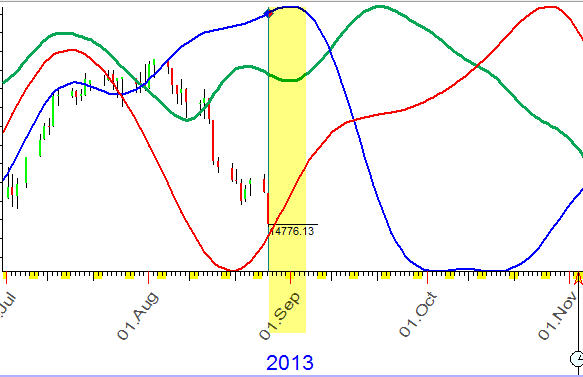
After exploring Annual cycle, I would also keep an eye on Venus synodic cycle (green curve) and analogy with year 1986 (red curve). Please look at how these cycles has worked the last 3 months:
Putting all these projection lines together, we can get some picture for the future. It looks like the non strong uptrend movement for the next week is more probable:
July 15-17, 2013
Updated August 28, 2013
Toronto
Canada