The things that I do not understand ...
written by Sergey Tarassov
Once the greatest scientist Sir Isaac Newton compared the life of the researcher with a boy looking for shells and marbles on the shores of the Ocean. He treasures what he finds. However, this is just a tiny part of treasures of the great Ocean that are visible/reachable for us. What we know now is like those marbles that the Ocean allows us to reach. And beside and beyond that is a huge area of what we do not know yet (it is what the Ocean hides from us).
Doing stock market data analysis for many years, from time to time I came across some phenomena that could not be explained in terms of modern knowledge, at least as I know it. In most cases I had to put these outrage models aside, just to avoid users' questions that I would not be able to answer. Most of these models were obtained by chance, as a result of some mistake when I tried to do something else. As Hegel said, "The Destiny comes in the clothes of Chance".
Here I would like to introduce three models of that kind.
Sun+Moon model
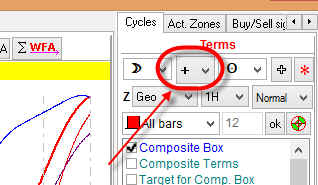
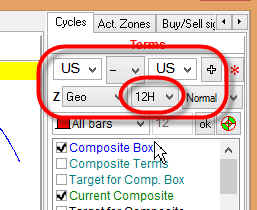
Recently I have added this option to Composite module:
It allows to calculate a projection line based on a superposition of longitudes of two planets. And as an example, the Sun plus the Moon longitudes are considered. What we get we can take as an artificial object, and a period of its cycle is 25.44 days. I am not a big fan of artificial objects, but... Surprisingly I have found that this cycle works better than all Moon based cycles (DJIA analyzed).
Why longitude superposition? I do not know...
From the physical point of view, it makes sense to analyze the angle separation between planets, not superposition of their longitudes. Knowing the angle separation between the Sun and the Moon, we can calculate Moon phases, Moon tidal force, any aspect between the Sun and the Moon and any planets etc. What physical sense may lay behind a superposition of planets' longitudes?
My personal opinion is: modeling the stock market, we should think not in terms of forces like in physics (as an example, a tidal force for the Moon), but in terms of metrics. I will explain what I mean. We are too used to think in terms of conventional thinking. For a change, let us image some hypothetical World. It looks like our Universe, and every thing in it is very similar to ours. The difference is that the inhabitants of that World do not have clocks as we do - no mechanical, no electronic, no atomic clocks. They have no idea of hours, minutes or seconds. Instead, they measure their time using the superposition of the Sun and the Moon longitude, i.e. they measure the time in degrees. According to that, they can say that some important event took place 1247cycles 50 degrees ago (while we would say about years and days and hours). And it would mean that since the event the Sun+Moon angle has traveled 1247cycles 50 degrees. To us, it is irregular/non even time. However, for some reason, this time measure is more suitable for the stock market. If the inhabitants of that imaginary World would play on the stock market (as we, Earthlings, do), they would use a very similar price chart. The only difference between the price charts would be X axis. We, the Earth inhabitants, used to display time on X axis in days (some traders prefer to exclude non trade days while others use all days). And the inhabitants of that imaginary Word would display on X axis the degrees of Sun+Moon superposition, just because it is more understandable and more convenient to them. Moreover, they could claim that some standard techniques (as an example, Gann fans) provide more accurate results than our Earth charts. The mathematicians of that World would say that this is because the TIME metrics of their World is more suitable for the stock market reality than our Earth atomic time.
You see, this way we try reconstruct TIME in which the stock market exists, we try to reconstruct its true metrics. We could say that sometimes it makes sense to consider planetary angles as something that generates the time flow. In our example we consider summary time generated by two major astronomical objects, the Sun and the Moon. It is like the Sun generates one time flow and the Moon another, while the stock market exists in a superposition of these two flows. But once again, take this statement as a hypothesis only. We are looking for the TIME/TIME FLOW in which our price chart reveals more order, we are looking for the most adequate METRICS for it.
You can find some info about metrics here: http://www.timingsolution.com/TS/Articles/metrics/index.htm
Also I recommend this article (the very first time when I faced this effect was when creating the model for Sun spot activity in 2005): http://www.timingsolution.com/TS/Articles/Time_Metric_1/planetary_time_1.htm
Presidential month
Recently I made one more addition to Composite module. It is a possibility to calculate a projection line based on Presidential (USA Presidential elections) cycle:
http://www.timingsolution.com/TS/Articles/customized_cycles/
We can take this cycle as a cycle generated by some artificial object that makes a full cycle of 360 degrees within four years between two Election days. It is a kind of one Presidential year. Let's calculate one more cycle, Presidential month cycle, this is period within which our "Presidential Elections" object passes 30 degrees, i.e. this 1/12 way of full 4 years Presidential cycle.
With Timing Solution you can calculate this cycle this way: 12th harmonic of Presidential cycle:
Surprisingly this cycle works. The period of this cycle is 4 months, i.e. this is not a quarterly cycle. This cycle is close to 116 days of Mercury synodic cycle, but Presidential month cycle works much more stable than Mercury synodic cycle. I do not understand why this analogy with Annual cycle works at all. Presidential month is an analogy of Solar month (the period within which the Sun passes one 30 degrees sign of Zodiac), but lasts four times longer.
Dynamic model
This is the first astronomy based model that gave me a stable positive result ten years ago. It is called in Timing Solution "Dynamic model". This is astronomy based model, though it does not consider angles between planets (like conjunction or opposition between any two planets). Instead the program analyzes the planet's movement to these angles. Like waxing Moon indicates the period prior New Moon - we are waiting for the New Moon to occur. Waning Moon - a period prior Full Moon we are waiting for the Full Moon. I guess it reflects the stock market reality: the expectation of some news (like FED news) often has more effect than the news itself. The stock market tries to go in front of the event. When this event takes place, the stock market has already accepted it in the price chart. So we apply to this model different astronomical events (like two planets moving to conjunction, trine, opposition etc.),
Very similar to this approach is Optimistic/pessimistic model: http://www.timingsolution.com/TS/Articles/waxwan/
August 30-31, 2013