 sets the LBC on the last available price bar; this is a final forecast. To
calculate Annual committee (committee for Annual cycles), follow these
steps:
sets the LBC on the last available price bar; this is a final forecast. To
calculate Annual committee (committee for Annual cycles), follow these
steps:Committee
Committee technology comes from Neural Network science application. The general idea is simple: we display several different projection lines upon one chart to see all possible variants of the forecast.
Let us start with Annual cycle. I am able to download the price history for Dow from the year 1885 till now (2008). It is 123 years of price history. And we need to calculate the Annual cycle. But - there is a question: how much history is it better to use for the calculation of the Annual cycle? We may use all 123 years of price history. However, there is some opinion: we need to use only the last 5-6 years as the stock market in 1970s and the stock market now are totally different entities. Another opinion is to use 20 years of price history (20 years form so called Kuznets' cycle used by some economists). We can spend a lot of time discussing these and other options, and the truth will continue to be out there. Timing Solution users are in better position here; they do not need to choose one option or another. They may run Committee feature instead.
Annual Cycle - Annual Committee
Let us draw several Annual cycles calculated for different lengths of price history, and
draw them together on one screen. I have downloaded Dow Jones data from the year
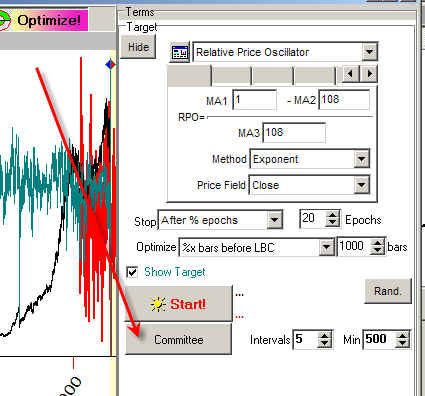
1885. Clicking on this button
sets the LBC on the last available price bar; this is a final forecast. To
calculate Annual committee (committee for Annual cycles), follow these
steps:
In a moment you will get this:

These 5 Annual cycles are based on different price history data. The red one uses the last year of price history while the blue one is based on all 123 years of price history.
To see the color legend, run "Strategy" module clicking here: 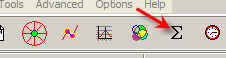
Here it is:
Looking at the forecast, we can say this: if the Annual cycle is calculated by using the last year or the last 42 months (almost 4 years) of price history, the Annual cycle points at the up trend movement in September (3 years up trend against one year's side). And if we watch the Annual cycles calculated for 12, 38 and 123 last years of history, we should acknowledge the existence of September drop. It worked for more than a hundred years though for some reason it did not work for the last 4 years. I think that in this year 2008 the stock market is back to its normal state, and its old pattern is back.
Bradley Barometer - Bradley Committee
The committee approach can be applied for other forecast methods. As an example, we can apply it to optimized Bradley Barometer (see the explanation here: http://www.timingsolution.com/TS/Mini/5_1/index_2.htm and http://www.timingsolution.com/TS/Mini/5_1/index_3.htm). In this case, we use different length of data to adjust the aspects' weights.
We can adjust weights for the aspects using the last 2 years of price history (it makes 500 price bars for daily data) or we can use for that all available price history.
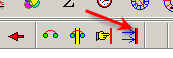
To calculate the committee, click this button in Bradley Barometer:
And you will get this:
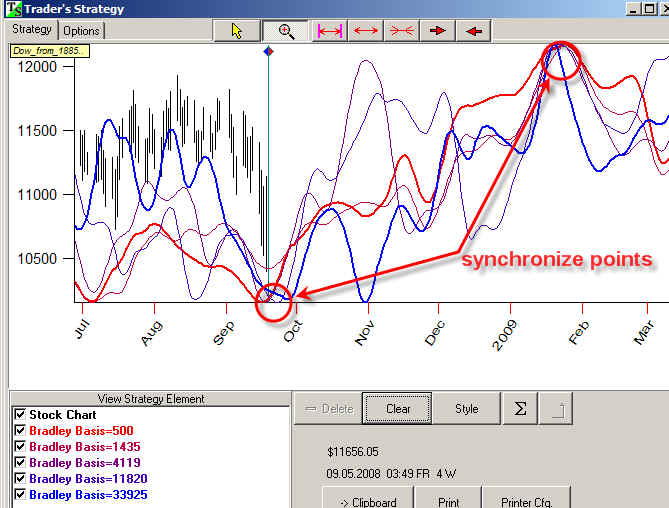
These projection lines are based on different price history that has been taken into account: Red - 500 bars (2 years), the other one is for 1435 bars (about 6 years) etc.
I would like you to pay attention to "synchronic" points when all projection lines indicate the same turning points.
Spectrum Module - Spectrum Committee
You can use committee technique in Spectrum module as well. When you calculate spectrum to find dominant cycles and drag these cycles to the Main Screen to get a projection line (this technology is described here http://www.timingsolution.com/TS/Study/E/4.htm), you will get this:
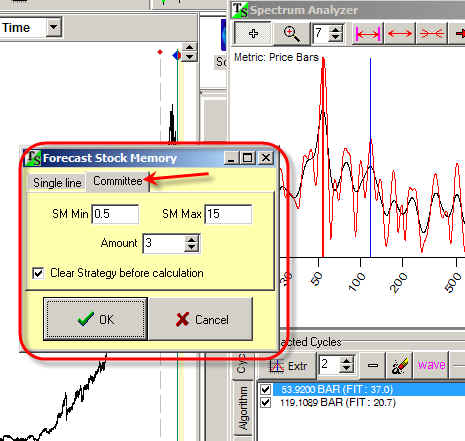
Here you can create either a single projection line based on calculated cycles ("Single line" tab) or you can calculate committee ("Committee" tab) which has several projection lines based on these cycles.
The most important parameter here is stock memory "SM", it varies between 0.5 and 15:
![]()
It indicates how many price history is used to get a forecast. In this example the stock memory varies between 0.5 and 15. So the first red projection line of this committee is based on 0.5 cycles of history, it takes into account the last cycle only. While the last blue projection line is based on 15 cycles of price history, so it looks deeper into market's history. The first model is concentrated on the most recent price movements only, while the second projection line tries to deal with the whole picture:
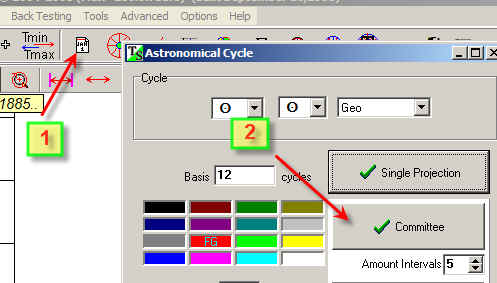
The same manner you can apply committee technique for astronomical cycles ("Astronomy" button). For example, working with 20 years price history we need to figure out how Venus synodic cycle works. The period of Venus synodic cycle is 563 days. To get committee for this cycle we calculate this cycle using last 642 days (a bit more than one Venus synodic cycle),1500 days, 9.6 years and whole 20 years of price history. To calculate the committee for astronomical cycles use this button:
I always use red color for projection lines based on the latest (the most recent) price history and blue for projection lines based on longer history time frame:
Remember that working with the committee, you actively use Strategy window (it
is here ).
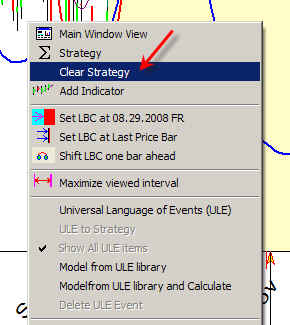
You can manipulate these projection lines there. Also if you need to remove all these projection lines at once, i.e. clear our committee, - it is easier to perform this procedure making RIGHT mouse click on the Main Screen. In the menu that appears, choose "Clear Strategy" option: