Fading cycles of the stock market
In this small article I would like to emphasize one important fact regarding the application of cyclic models in Timing Solution. My point is that the cyclic research in physics and the cyclic research applied to financial data are two different entities. I will explain why.
Hidden cycles. These are typical cycles that physicists deal with. For example, in 1950 Julius Bartels researched the effect of the Moon tidal force on ionization of F2 layer ionosphere (regarding F2 layer, see this: http://en.wikipedia.org/wiki/Ionosphere "The F layer or region, also known as the Appleton laye,r extends from about 200 km to more than 500 km above the surface of the Earth") . This is a good example of a very typical scientific problem: here we deal with some fundamental phenomenon that works now exactly the same way as it worked 1.000 years, and there is no need to worry that tomorrow the Moon will affect the ionosphere somehow differently. The effect of the Moon tidal force on the ionization of F2 layer does not depend on important corporative news or on FOMC actions. This is itself a fundamental phenomenon. The scientist will look here for a cycle (or cycles) that is not obvious, that is hidden. Classical math is able to reveal such a cycle, and we may apply methods of classical statistics here - which is what Julius Bartels actually did.
Faded cycles. Dealing with financial data, we enter another World . Any of our models (tested and proved to be good) can be destroyed the very next day (or a moment) by some important corporative news, FOMC action or by thousands and thousands of other factors (including those that are interesting to physicists). We deal with the cycles that are born, live some time and then die. These cycles are not hidden; quite opposite, when a cycle is born, it notifies the financial market world about its existence very loudly (just think about all those forecasts that were made and did not come true). When this cycle reaches its culmination, i.e. at the maximum of its appearance, there will be somebody who will make this cycle known, and the talks about it are spreading quickly among the traders. The talks about this new cycle may be indirect: we may here about some moving average with specific smoothing period, or Relative Strength Index with a specific period, or some special phenomena (like the mentioned above Moon tidal force) etc. It does not really matter which indicator is actually discussed - when the cycle is present, there are a lot of possibilities for its representation. What is really important the fact that all these indicators are workable till this specific cycle is in force, and all these "wonderful" indicator stop working when this cycle loses his energy and dies. This is tough stock market reality; when some successful technique becomes obvious for everybody, this is a sign that it is stopping to work. Therefore, the cycle that we can reveal in financial data is not the same cycle that affects F2 ionosphere's layer 200-500 km above us due to the Moon effect. I can compare the stock market cycles to a very smart con artist who creates the illusion of some "nice" reality with only one purpose - to take our money. So our main goal is to find out when this guy begins to play his game (we can use it for our advantage) and to be prepared to leave this game when too many people are involved and the guy may close the game. Instead of revealing hidden cycles (as the scientists studying the fundamental phenomena), we deal with fading cycles - that appear, exist for some time, then lose their strength and disappear, giving a room for other cycles. Applying classical statistics criteria is not so important here, the most important question is whether this cycle is alive or it is fading ("to be or not to be that is the question").
With Timing Solution you are able to monitor the cycle's "age". All cyclic models in Timing Solution deal with this kind of cycles.
We do it in Wavelet module: http://www.timingsolution.com/TS/Study/Classes/wavelet.htm
This is example of 15 min chart for S&P 500 mini futures together with its wavelet diagram:
Look for bright strips closer to the end of the data. In our example, the horizontal bright yellow stripe indicates the active 155-minutes cycle. Drop this cycle on the Main screen; immediately you get the projection line based on this cycle.
Another important issue is the age of the analyzed cycle, it is called "stock market memory" (sm). Usually cycles live 4-12 full periods, so I would recommend to count vertical stripes while you move the mouse cursor throughout the wavelet diagram:
You see the yellow horizontal stripe that corresponds to 155-min cycle is covered by 7 vertical stripes; it means that the age of the analyzed cycle is 7 periods. Practically it means that if you plan to use the model based on this cycle, do not expect it to be working for more than these 7 periods.
To reveal the cycle, we need the price history data that cover 3 periods of this cycle; this is childhood of cycle. After that, there are two possible scenarios there/ The first one is: the cycle may live a long life of 7-12 full cycles. It means that we can trade within this time span using standard Technical Analysis indicators. However, in most cases the cycles do not live that long, usually it is 3-4 full cycles. The wavelet diagram below shows the most tradable cycles since September 2010 till the end of February 2011 (it is 6 months in total):
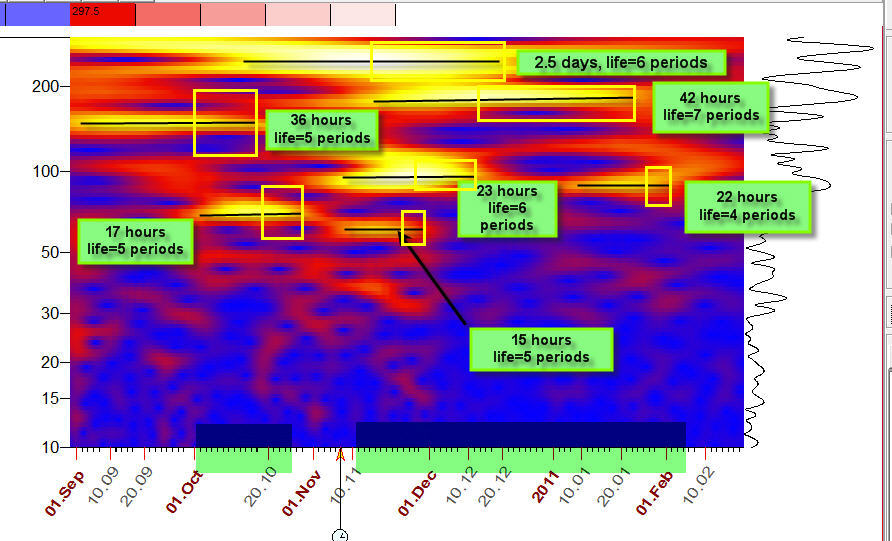
Within these 6 months, I have found 6 "long and tradable" cycles. These cycles with their periods and life time spans are shown on the diagram. To reveal the existence of any cycle, we need to have price history data that cover its 3 full cycles. If the cycle is revealed, we can trade it, this is an "adult" cycle. The adult (=tradable) periods of the cycle's life are marked by yellow rectangles on the diagram. So, the summary tradable period when "adult" cycles are present is big enough. We only need to keep in mind the age of tradable cycles.
I guess you may ask me about the relationship between Wavelets and Spectrum module (as you remember, the Spectrum module is designed to reveal cycles, too). The difference is that the Spectrum reveals the dominant cycle within some period analyzing the strength of all cycles there. Wavelet module sees the same cycles - only it sees them in time, from the moment of their birth till their end.
I have shown you how Timing Solution handles the question of cycles' life and longevity. To figure out why some cycles live longer than others (as well as the list of factors that may affect the cycle's life) is a totally different task. The potential solution of this problem lies beyond the application of spectral/wavelet/MESA/SSA and other math approaches. This is actually a huge field for a scientific research where we need to apply fundamental analysis. Huge computers are necessary to do the calculations. This task is much more than one person or a small research group can handle.
What actually wavelet module does? It allows to reveal a sinus wave in the financial data. Also, it is possible to do this job manually using Easy Cycle module (http://www.timingsolution.com/TS/Study/Easy_Cycle/)
If you cannot find the wave that describes your price chart, it means that the analyzed chart is not in cyclic mode.
Turbo Cycles module ( http://www.timingsolution.com/TS/Study/Turbo_Cycles/) allows to perform the detailed analysis:
In this particular case the program recognized two cycles 167 and 134 bars cycles instead of 155 bars cycle, actually you can see this fact on the wavelet diagram:
February 18, 2011
Toronto, Canada