Welcome to Timing Solution!
Demo version companion
First run
When you run Timing Solution Demo the very first time, you get this window:
It is OK, the program does now a lot of calculations to save your time later. This procedure is performed once only, and it takes a few minutes of your time. All calculations that will be produced later are based on these ones.
Downloading a price chart
Now you are ready to download the price history. You need it as your goal is to get a projection of the price for your financial instrument - a stock, an index, some futures; and the projection line is based on a detailed study of your stock's history.
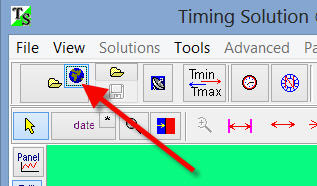
Click this button:
and follow these steps:
While downloading the price history, do not forget to choose the exchange location here:
For astro based models, this information is extremely important.
The price history can be organized in many ways. It should not worry you as Timing Solution supports a lot of text formats, Metastock and CSI formats, e-Signal data feed system. You can find more info regarding this issue here: http://www.timingsolution.com/TS/Study/Formats/index.htm
Also there are a lot of financial information can be downloaded through Yahoo and Quandl financial service. In order to do that click this small "Globe" button:
Type Yahoo or Quandl symbol there and click "Download":
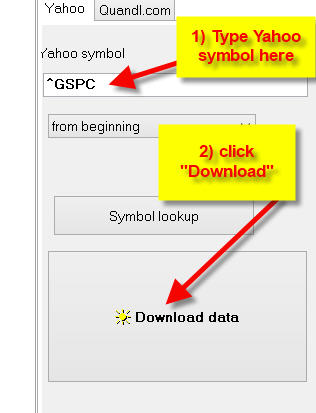
Here ^GSPC - Yahoo symbol for S&P500 index.
Here are other examples:
^FTSE - FTSE100
^GSPTSE - Toronto (TSE) composite index
^TASI - Saudi composite index (Tadawul)
^AORD - ASX All Ordinaries
^NSEI - CNX NIFTY
IMB - International Business Machines Corp. shares
and many many others...
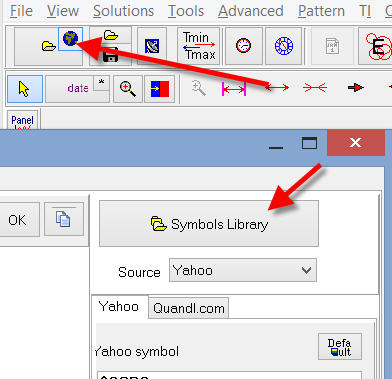
Many financial instruments can be downloaded through standard symbols library this way:
In this video class you will find detailed explanation how to download the price history using Yahoo and Quandl financial services: click here.
After downloading price chart click "Calculate" button:
Now the program is ready to work for you.
Price chart manipulations, charting tools, indicators
There are some things that you need to know before working with the program. These are the most common operations available in all programs for technical analysis (though Timing Solution is more than just a technical analysis software): price chart manipulations, different charting tools and indicators. Below is the overview of these things.
When the price history is downloaded, you can do any screen manipulations with your price chart.
As an example, you may prefer to view not the whole price chart, but its small part with the details. Do this:
You can move this interval to see the price history prior or after the selected interval. Do this:
Also you can use these buttons to manipulate the viewed interval:
Move the mouse to any of these buttons. You will see there what this button is for.
Dealing with any charting tool, follow these steps:
Here is an example of drawing the Andrews pitchfork:
When the basic tool is constructed, you may modify it this way:
To display any indicator that are widely used in Technical Analysis (moving averages,
MACD, RSI ...), click this button: 
"Smart" charting tools
You will find in Timing Solution many very common features available in other software that analyzes the stock market. However, Timing Solution does much more. Beside pitchforks, Fibonacci grids, wedges and many other charting elements (that are drawn overlaying the price chart), Timing Solution provides a new category of "smart charting" tools. As an example, let us take a tool based on Fourier analysis. You do not need to know too much about it or do any calculations. You simply choose this charting tool and drag your mouse from the starting point of your choice to the place where you want to stop it. The program itself studies the price chart, calculates the most fitting Fourier curve and provides the projection line based on it:
This (teal) projection line can be prolonged as long as you need.
More about "smart" charting tools is here: http://www.timingsolution.com/TS/Study/ts_charting_tools/index.htm
What techniques can we trust?
Timing Solution is not a simple software. You will have to spend some time learning its possibilities. Also, this is a system that is improving all the time (it includes software development, search for new techniques, and back testing). When you become a Timing Solution user, you will participate in this process, too.
You will have a right to be a part of Timing Solution Yahoo Group. There you will be able to ask any questions regarding the software and market forecasts, bring attention to the topics of your interest (related to Timing Solution software, of course!) and share with others your thoughts and opinions. TS Yahoo Group is very active.
Also, we publish regularly our findings on the website: http://www.timingsolution.com.
Below some modules of the program are discussed. With these modules, you can start making your projection lines immediately.
Start with Annual cycle
Set this option ON, and you will see right away the Annual cycle for your financial instrument (it is based on the price data that you have downloaded previously):
There are TWO Annual cycle curves here: the blue one is based on all available price history, while the red one is so called "fast Annual cycle" - it analyses the latest three years only.
Even this simplest module allows to calculate very interesting projection lines like Decennial cycle, Weekly and Monthly cycles, Daily cycles (for intraday). More about this module is here: http://www.timingsolution.com/TS/Mini/49/index.htm
Dominant cycles
This module looks for the cycles that might be the most powerful for your financial instrument and creates a projection line based on such cycle (cycles). You do not need to know Fourier analysis, you do not need to know spectral analysis, you do not need to know MESA theory (if you do not want to). The only thing you need to have is the common sense; the only thing that you have to do is dragging the mouse. All complicated math is behind these mouse manipulations. Do these very simple steps:
Step #1: find the most powerful/influential i.e. dominant cycle.
Click this button: ![]()
Step #2: The peaks on this diagram correspond to the most powerful cycles:
X axis represents the cycle's period; Y axis shows the strength of this cycle.
Pick up one of them. Let it be the cycle with the period around 100 days. Simply make a mouse click near this peak.
The program automatically "catches" the period of this cycle, and you will see this cycle here:
As you see, the exact period of this cycle is 118 days.
Step #3: Now simply drag this cycle to the price chart:
Step #4: the projection line based on 118 days cycle will immediately appear on the screen:
This projection line can be prolonged into the future as long as you need.
Step #5: you may pick up several dominant cycles and calculate a projection line based on several cycles:
It is highly recommended to vary the amount of overtones.
This technology can be applied for all types of data (daily, monthly, intraday). More about this technology is here:
http://www.timingsolution.com/Doc/level_1/4.htm
Astro cycles
Clicking this ![]() button,
you can make a projection line based on any astronomical cycle.
button,
you can make a projection line based on any astronomical cycle.
For example, you can easily calculate (and see) the Mercury phase cycle. Just choose these options (see the picture below), and the program updates the projection line for this cycle automatically:
or Mars-Uranus cycle:
You can combine these cycles.
This technology is explained in this class: http://www.timingsolution.com/Doc/level_1/5.htm
Turning Points Analyzer: revealing support/resistance levels
Clicking this button  ,
you get this colored vertical diagram:
,
you get this colored vertical diagram:
Here the horizontal red stripes represent the most probable price levels where the BOTTOM turning point may occur. We calculate these levels through the statistical analysis of the available price history.
This technology is explained here: http://www.timingsolution.com/TS/Articles/waves_in_moon/waves_in_moon.htm
And many many more ...
To give you an idea what you will find in Timing Solution software, see below the list of buttons and the according techniques:
- Planetary lines
- Phenomena
- Upcoming events (aspects with their probable effect on the stock market):
- Bradley Barometer (Classical and optimized)
and many more...