TS Standard model - cycles in finance
What is TS Standard model?
Here I would like to share with you my view on cycles in finance as I see it now (2013). Practically all statements here can be marked with "it looks like" instead of "it is so and so". But - we have to accept some concept for research, otherwise we will be drawn in abundance of different models and theories and fall into "analysis paralysis". Of course all these concepts and models will be improved/modified in time - even rejected. Then we need to suggest another concept/model which will concentrate our knowledge at that time. This is a way how the science goes..
Fixed (math) cycles - looking fot a beneficial period
Fixed cycles have a persistent nature. It means that fixed cycles do not live forever; they are born, are alive for a some time and then die/disappear. Wavelet module allows to reveal these stages in the cycle's life.
BUT, there is a very important question there: can we use those persistent cycles for trading or not?
Here is an example. Suppose we have found 100-days cycle for some financial instrument, and the analysis shows that this cycle's life is 700 days (i.e. 7 full cycles). Practical experience says that we need full 3-5 cycles to reveal this cycle. I.e., to reveal 100-days cycle within our data set, we need to have at least 300 days of available data, and the cycle must be active there. It would be better to have 500 days. And this amount of data is necessary just to find and confirm our cycle's presence. While this cycle is revealed, it can be used for trading. The final score looks this way: from 700 days when this cycle is active, we need 500 days to reveal the existence of that 100-days cycle (i.e. to calculate its period and phase), and the remaining 200 days we can take benefits of our knowledge. So, in brief, our scope is: the research period is 500 days, and the beneficial period when we may convert our knowledge into the money is 200 days.
This is a very important fact: its ignorance can hurt your trading account. You can be very impressed by some cyclical picture that shows the presence of some cyclical wave in your price chart. It is a trick used by some when they advertise a magic trading tool. Do not be fooled by that appearance. Remember the main question: will this cycle still be working after the moment when it has been revealed? Does this cycle have some beneficial period or not? Very often we face this situation: the cycle stops working/dies immediately after the moment when it has been revealed. Immediately after the moment when the standard math procedures (like spectrum, wavelets) specify this cycle, it stops working. You may decide that it does not like to be visible for everybody, you may call it "a shy cycle". However, there is nothing mystic or extraordinary here. If we look back at our example (100-days cycle which is active for 700 days), that situation will definitely occur to us - if we do our cycle analysis on 699th day of that cycle's life. So, it is not a big deal to catch a fish, the big deal is to catch it alive.
This is why walk forward analysis in Timing Solution has been developed - to specify the cycles that have some beneficial period. There the totally different math methods are used than in classical cyclical analysis. This is many times more complicated task, and it needs a lot of calculations, it is a kind of "Digital fortress".
For this purpose Turbo Cycles backtesting module is recommended ("Terra Incognita" project: http://www.timingsolution.com/TI/5/index.htm ). Download any financial instrument and run this module. Very fast the program performs a lot of calculations. In fact, the program analyses 360 different cyclical models (starting from classical spectrum analysis and ending with MESA dominant cycles) and conduct full Walk Forward Analysis (WFA) for each one of these 360 models!!!
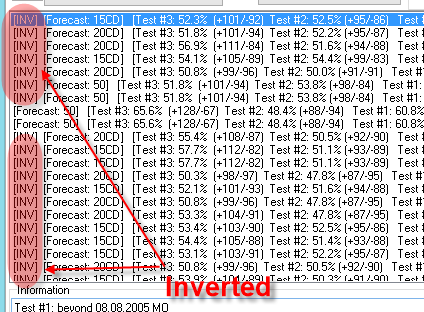
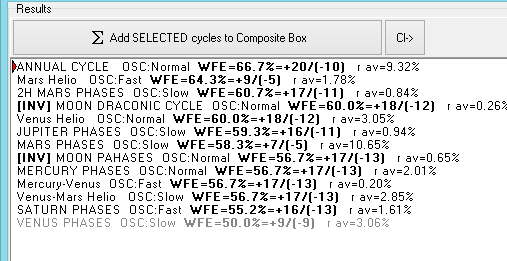
After the calculation you get the table like this:
Pay attention: in this example the most of models are INVERTED. I believe it means that the cycles for this financial instrument have no beneficial period, these cycles stop working after the revealing period. It was example for Dow EOD chart.
If we apply the same backtesting procedure for Dow 5 min chart, you will get the result like this:
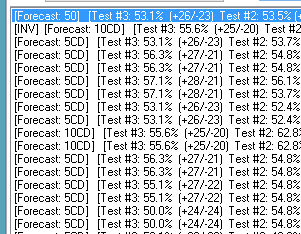
It means that for 5min Dow chart you can apply the cyclical analysis, there is some beneficial period for cyclical models applied for 5 min chart.
So our recommendation is: before applying the cyclical models for some financial instrument, run back testing module to check the existence of beneficial period.
The table below shows beneficial periods for different charts:
| Financial Instrument | Beneficial period |
| DJIA EOD chart | Not |
| DJIA 5 min chart | Yes |
| Euro/USD EOD chart | Yes (?) |
| Euro/USD 1h chart | Yes |
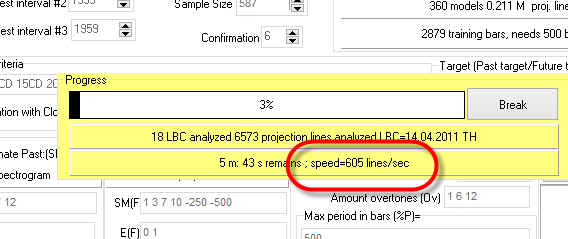
BTW, this backtesting module employs very sophisticated math, this is the most advanced module I have developed in my life. You see, the main problem here is the calculation time. This module in our example generates 600 projection lines per ONE second. Some years ago, when I worked on the first approach to this module, we conducted backtesting using standard procedures and it took the whole day to calculate 1000 projection lines, i.e. the proper backtesting procedure for one financial instrument only would take about one year of calculation time. So, we decided to put this task aside till the time when the quantum computers will be available. And now we have found the way how to conduct these same calculations in 6-10 minutes using our regular computers!
Astro cycles - permanent cycle
Opposite to math (i.e. fixed) cycles, astro cycles are permanent cycles. Their main parameters (such as period and phase) are constant as they are defined by Laws of Nature well-known to scientists. Though the effect of those cycles on financial markets may differ, most of them provide the same effect all the time, the difference usually is due combination of the cycles. This fact makes our life much more easier (Walk Forward Analysis is much more easer in this situation).
If in fixed (math) cycles our main focus is to find the cycles that have some beneficial period, for astronomy based cycles our main goal is to find the astro cycle that works best for our financial instrument. It may be Annual cycle or Moon tropical cycle, or Moon phase cycle, or Mercury synodic cycle etc. etc.
So our target is to find the planetary combination that works the best. The technology of finding astro cycles is explained in this class: http://www.timingsolution.com/Doc/level_1/5.htm
Also you can apply Walk Forward Analysis in Composite module:
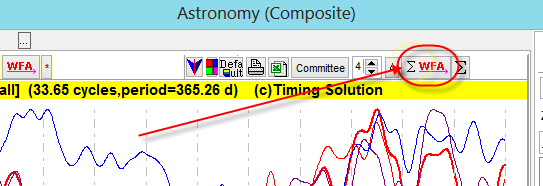
After calculations you will get the list of the most workable cycles:
Moon cycle - special case
The Moon cycle is a special case. It looks like the Moon combines the features of math (persistent) and astro (permanent) cycles.
Moon cycle very often works as a permanent cycle. For example: this composite shows a general tendency of the effect of the Moon phases on Dow price. It shows that price tends to reach TOP two days after the New Moon:
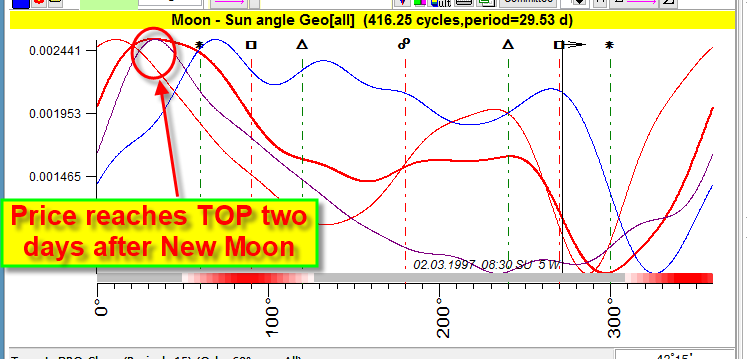
This is a permanent cycle, it reveals the stable pattern in the Moon phase cycle.
But sometimes the Moon works as persistent cycle. In other words, sometimes cyclical patterns based on the Moon cycle appear (Moon phases, Moon tropical and Moon Draconic cycles), these cycles appear, live for some time and then disappear. It looks like the typical time of the existence of this pattern is one year, may be less. It is difficult to say what mechanism lies behind this phenomenon. Maybe some mass psychology patterns appear, make resonance with some Moon cycle, and this resonance gives to this pattern an energy to exist for some period of time.
The technology of revealing Moon persistent cycles is explained in this class: http://www.timingsolution.com/TS/Articles/moon_model/
May 28, 2013
Toronto, Canada
Sergey Tarasov