Timing Solution Demo installation
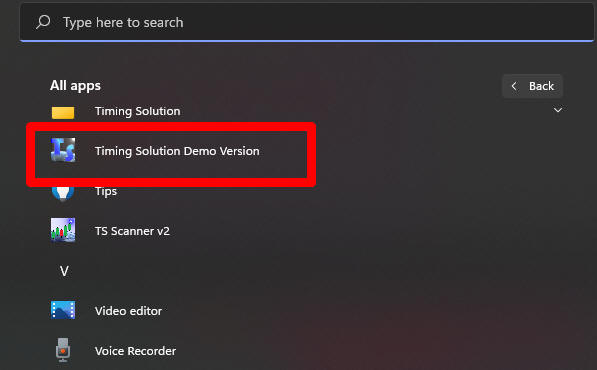
Please unpack this file and run ts_setup_demo.exe file. After the installation click "Start" menu and find there "Timing Solution Demo Version" item:
After the first run the program conducts a preliminary calculation getting ready to do the job (it takes 1-3 minutes). This progress window will be displayed:
Restriction for Demo version
With the Demo version you can create the projection line only up to some specified date:
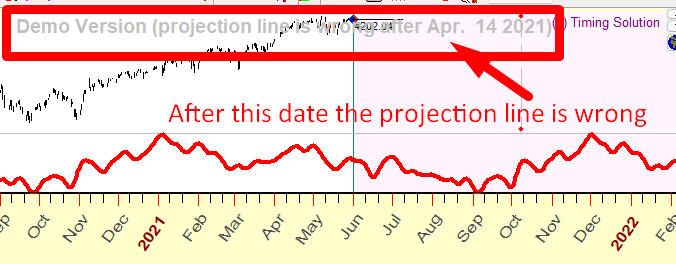
You can work with any price history data prior to this specified date (April 14, 2021, in the example above). Beyond this date, the projection line produced by the program is not correct and is not recommended to use:
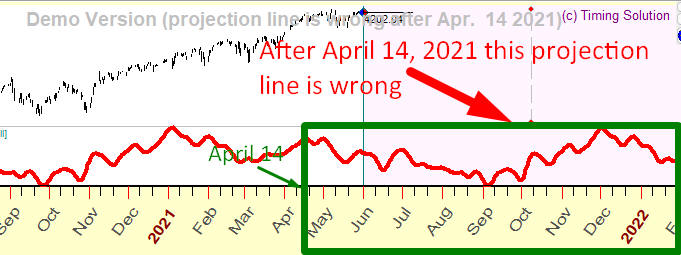
Here the projection line continues after April 14, 2021, though you should not trust it. Still, you can check the forecasting abilities of Timing Solution software using the price history data before that date.
Another restriction relates to the showcased features. You can try modules that are present in Timing Solution Advanced and Timing Solution Primo versions. Modules developed as a part of Timing Solution's Terra Incognita project are not available in the Demo version.
QuickStart
Fast introduction to the software is here: https://www.timingsolution.com/Doc/level_1/1.htm
Price history and data feed - Timing Solution supports many data formats, including almost two thousands of text and Excel formats, MetaStock, CSI files, stream (real time) price history data through eSignal, etc. The detailed explanation regarding supported formats is here: http://www.timingsolution.com/TS/Study/Formats/index.htm
Points of interest
Depending on your interest, trading style and experience, you may want to explore these features first:
Point of interest #1: Math based cycles and Intermarket analysis
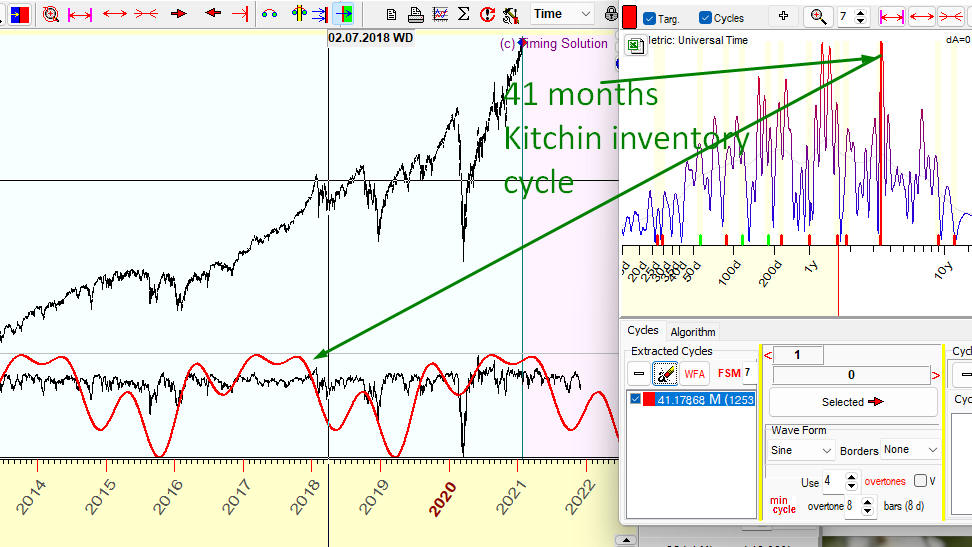
If you are used to methods of Technical Analysis, you will be more likely willing to try the application of classical cyclical analysis techniques. Run the Spectrum module; it reveals the most important cycles that might be present in your data (mathematically speaking, it is Fourier transform). Often you will see there one of the most important economical cycles - Kitchin 39-42 months cycle; it is one of the basic economical cycles, and the highest peak on the periodogram confirms that. The projection line based on this cycle is shown in the Main screen:
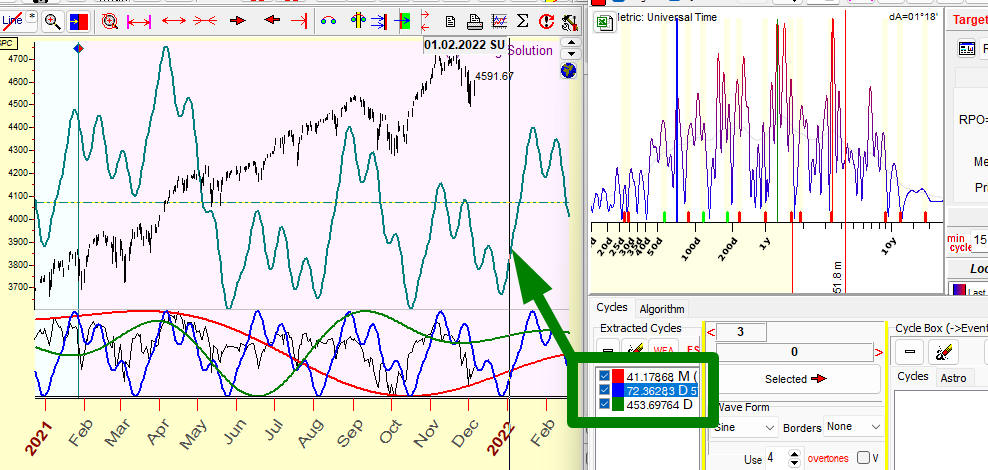
You can choose several important cycles in the same way and see their action separately or as a superposition. Here is the projection line based on three cycles:
This technology is explained in this class (with a video): http://www.timingsolution.com/Doc/level_1/4.htm
We recommend as well this very detailed "Crash Course on Cyclical Analysis": https://youtu.be/vpaTYYqvVjw
Followers of Larry Williams's approach may also try Q-Spectrum and Intermarket Analysis modules. Here are their descriptions:
http://www.timingsolution.com/TI/16/index.htm
http://www.timingsolution.com/TI/Intermarket_2019/
Point of interest #2: Astro based cycles
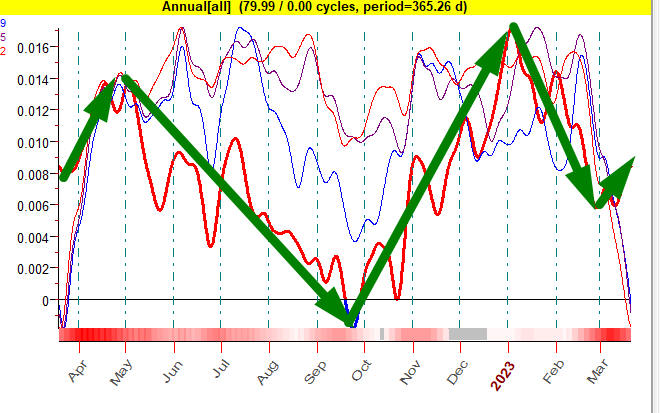
If you are familiar with financial astrology techniques, the software definitely can help you a lot. If you do not believe in astrology, at least you may look at what astronomy can do for you. The very first thing to try is the Annual cycle. No magic here; it simply shows the typical movement of your financial instrument within a year. This is the example for SNP500:
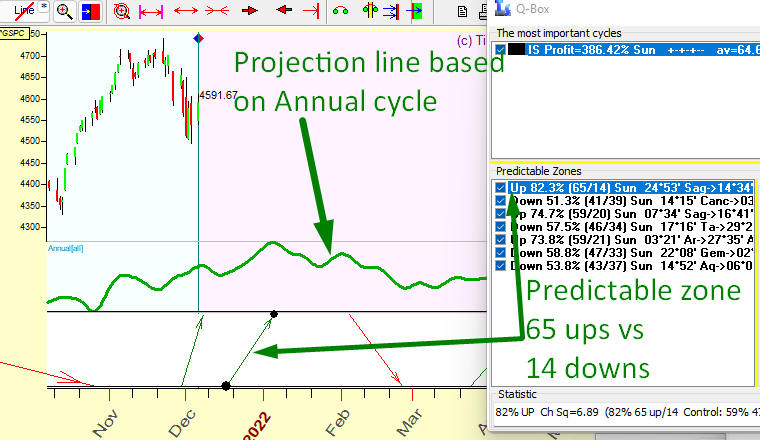
You can build a projection line based on the Annual cycle. Moreover, just because the software is able to go through years of history data for your financial instrument, it can calculate for you the best periods to trade based on the Annual cycle (so called predictable zones).
Here predictable zones from mid of December till the beginning of January are shown; 79 years of price history were observed, with 64 up movements versus 14 downs (Christmas rally):
The Annual cycle is the Sun cycle. In the same manner other astro cycles can be calculated. Look at this projection line based on Moon phases:
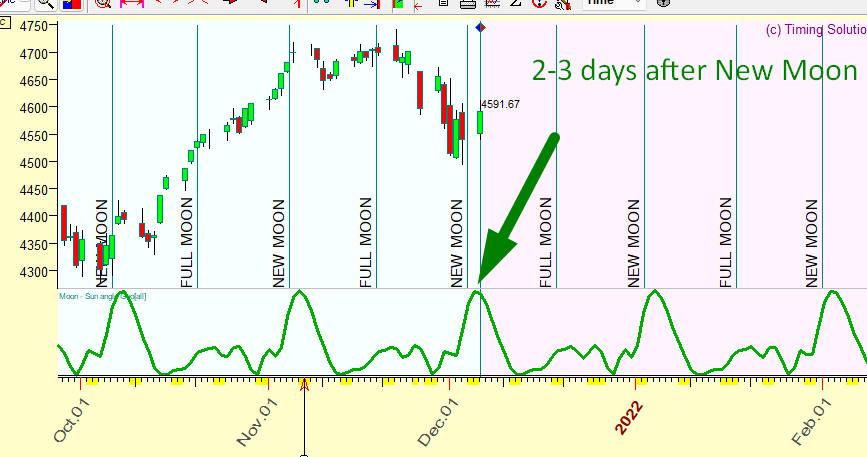
The statistics shows that SNP500 usually reaches some maximum in 2-3 days after the New Moon.
These are facts for non believers. If you are familiar with astrology and have no problem applying its methods to your trading, Timing Solution provides lots of tools taking care of all time-consuming calculations. You will find traditional techniques like planetary lines, or charts like this one below:
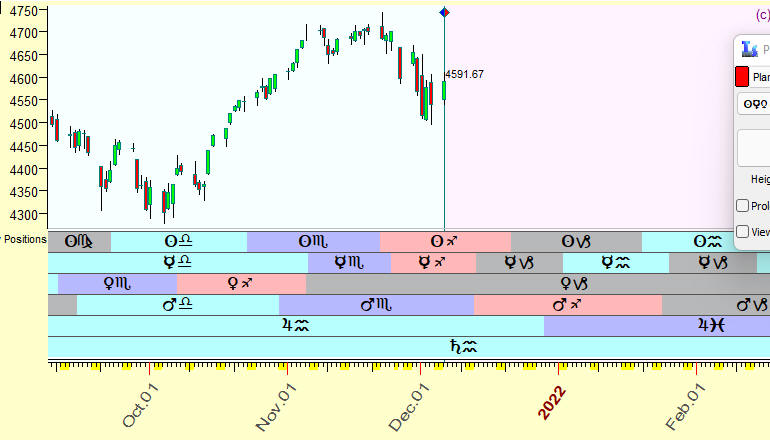
The software works with practically any known astro phenomena and builds projection lines based on separate astro events or their combinations. Plus, you can build a projection line with the help of Neural Network that analyses astrological phenomena and finds those that are most important to forecast the future movements of your financial instrument.
This is the class about astronomy module: http://www.timingsolution.com/Doc/level_1/5.htm
Point of interest #3: Charting tools
If you used to work with trend lines, Andrews pitchfork, Gann fans and other charting techniques, you will find lots of them in Timing Solution: http://www.timingsolution.com/TS/Study/ts_charting_tools/
You can perform rather sophisticated cyclical analysis even with the simplest charting tools : http://www.timingsolution.com/TS/Study/ts_charting_tools/#A4
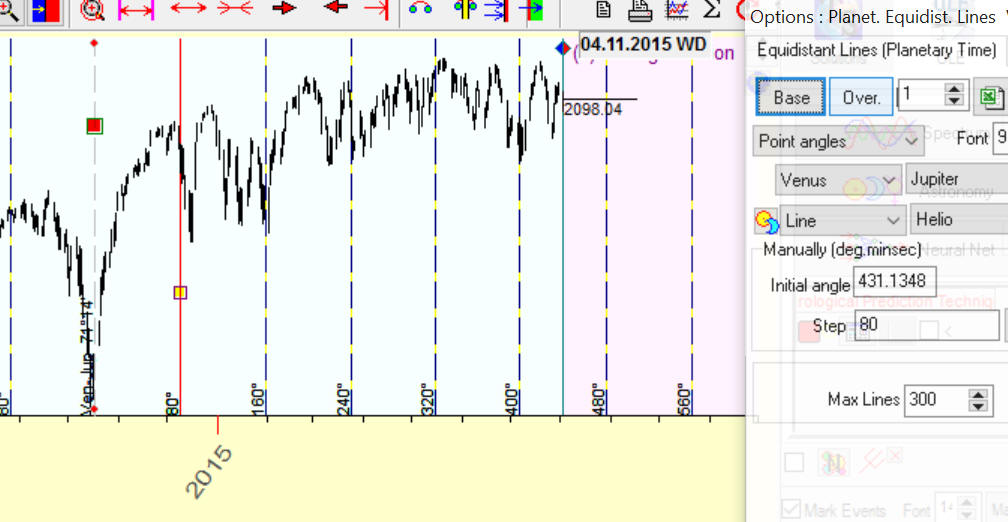
Try as an example the planetary equidistant lines charting tool. Vertical lines here represent the moments when the angle separation of Venus-Jupiter, heliocentric, is increased by 80 degrees; these are shown over market moves:
Please see this information on astro based charting tools: http://www.timingsolution.com/TS/Study/ts_charting_tools/index.htm#A5
If you are even more into charting, there is more for you in Timing Solution software. You can imitate what you would do if you were doing charting job on paper (as W.D. Gann did). Though it is a part of Terra Incognita project and not available in the Demo version, just keep that in mind as it is a very popular feature. (You can get it an add-on to any version of the software for a fee.) This module is explained here: http://www.timingsolution.com/TI/13/index.htm
To learn more about Precise Charting module in action, please see this: http://www.timingsolution.com/TS/Articles/AUTOCAD/
And this is the explanation how to properly scale the price chart: http://www.timingsolution.com/TS/Articles/gann_scaling/
There is definitely much more available in the software. Take your time. Begin with features familiar to you and give a try to new ones. Trading the projection line opens many new possibilities. It is a very interesting and exciting journey. You may want to try then modules of Terra Incognita project (not available in the Demo version). There we explore new possibilities following the most promising ideas. We do that in close contact with Timing Solution users. Any new development is tested by
Timing Solution Community
You can also be a part of it. It is Timing Solution Group at Groups.io, and a very active one. Just look at the topics we discuss there: https://timingsolution.groups.io/g/main/topics
Group members share there their experiences with the software, asking questions and getting answers. You will not be left on your own after purchasing the software.
How to buy the software
Timing Solution software has several versions available for sale. See here what is included in every version (click on any item to learn what it is about): http://www.timingsolution.com/TS/Comparison/
To purchase your copy of the software, use this Order Form: http://www.timingsolution.com/TS/Order_Form/index.htm
Please feel free to contact us if you have questions or concerns: http://www.timingsolution.com/TS/Contact_US/index.htm