Intraday models
Models overview
In Timing Solution there are several models suitable for intraday data.
Daily (Diurnal) cycle:
I recommend to start with Daily (Diurnal) cycle. These models are described here: http://www.timingsolution.com/TS/Mini/25/index.htm
Spectrum models:
These are math based models, sometimes we call them "spectrum models". The idea behind these models is pretty simple: we calculate the dominant cycles and use these dominant cycles to create a projection line. This technology is described in these classes:
http://www.timingsolution.com/TS/Study/Classes/class_spectr_1.htm
http://www.timingsolution.com/TS/Study/Classes/class_spectr_2.htm
http://www.timingsolution.com/TS/Study/Spectr1/
Don't forget to define correctly your time zone here and trade days/hours here.
Mandatory parameters for intraday models
Define Location:
Forecast models for intraday data based on astro cycles deal with transiting cusps. For those who are not familiar with astrology it is enough to know that this forecast is based on the cycles taking place within a day. Normally, planets (except the Moon) do not change their position significantly within a day. So, we need to analyze the planetary movements in respect to the horizon and the meridian. Any object on the sky during the day rises (crosses the horizon), culminates (reaches its highest point), sets and anti culminates. Therefore, we can specify the daily cycles for any celestial body. These cycles are related to the Earth's rotation which is the main component of this kind of cycles. Another component of these cycles is the planet's own motion. Due to these two components, these cycles are close though not equal to the daily cycles in common sense. For example, the Moon's cycle in respect to the horizon is approximately 1 hour longer than 24 hours pure daily (regular) cycle.
Creating the projection line based on these cycles, the first thing to do is to define the place on the Earth associated with your chosen financial instrument. And this is a difficult question. As an example, let us consider these three trading places:
| City | Latitude | Longitude | Time Zone |
| Tokyo | 35.42N | 139.46E | 9E |
| London | 51.30N | 0.10W | 1E |
| Chicago | 41.51N | 87.39E | 6W |
These places are located far from each other. The most important parameter that drastically impacts the quality of the projection line is LATITUDE. The longitude parameter is important as well; however, we can apply FAM model that compensates the discrepancy in longitude. I would say that Chicago's (CBOT) longitude is a good balance between Tokyo and London parallels.
Another approach is to divide the available financial data on three data sets (as in our example) for different stock exchange places - like Asian, European and American trade styles and make separate forecasts for each of these price history data sets.
When this decision is made (i.e., you have decided to deal with the whole data set for some particular stock exchange or with a part of data for each one of them), download the price history data:
As I have mentioned above, you should pay attention to the location parameters (latitude and longitude).
The next step is to define correctly the Time Zone. Do it clicking "Exchange Location" button and choosing ?????
Next step is to define the correct trade hours for your analyzed financial instrument. This is a very important procedure. Very often users ask me the question "Why Neural Network does not show the projection line?". In majority of cases this happens because you have not define trade days/hours correctly.
When you download the price history, use this button to define trade days/hours:
You can read more about that here: http://www.timingsolution.com/TS/Study/TZ/index.htm (see daily, daily intraday, weekly intraday)
Neural Network models
Open Neural Network module:
Define WHAT you want to forecast. In this example, I use the Relative Price Oscillator with the period = 10 bars:
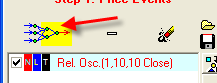
When I tried to make the model the first time, I used the oscillator with the period of 50 bars. But it looks like the shorter oscillator (10 bars) is more suitable for this particular financial instrument.
Define WHAT this forecast IS BASED ON:
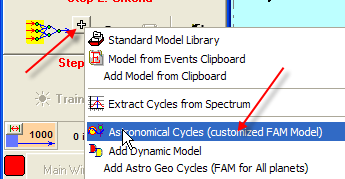
Now define the astronomical cycles to be considered. I have downloaded the price history for EURO/USD spot rate from 2003 up to the year 2006 (hourly data). In other words, about 3 years of price history are available for the research. Remember that you can use the cycles that are no longer than available price history divided by 3. I.e.. in this example you cannot use the cycles with the period longer than 1 year.
You can see the period of any astro cycle here:
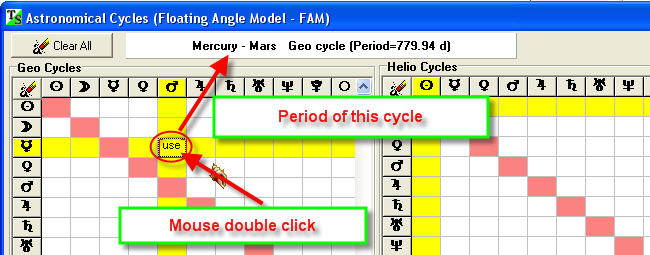
To choose any cycle you need to make a double mouse click on an appropriate cell.
So I started with cardinal cusps (Asc and MC) and the angles between these cusps and planets:
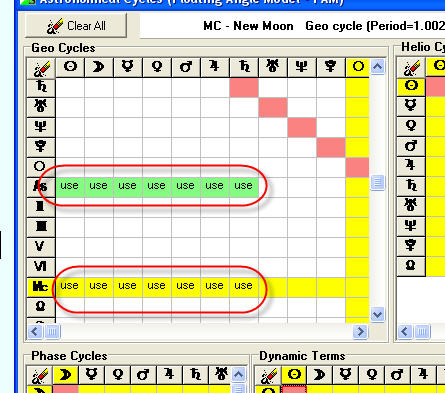
Here I defined 14 cycles based on the Earth's rotation and planetary movements:
Asc - Sun, Asc-Moon, Ac-Mercury, Asc-Mars, Asc-Jupiter, Asc-Saturn - here we use Asc point, that is related to the horizon.
MC - Sun, MC-Moon, MC-Mercury, MC-Mars, MC-Jupiter, MC-Saturn - these are meridian related cycles.
Do not use the opposite cusps, like Dsc and IC. These points do not provide the additional information.
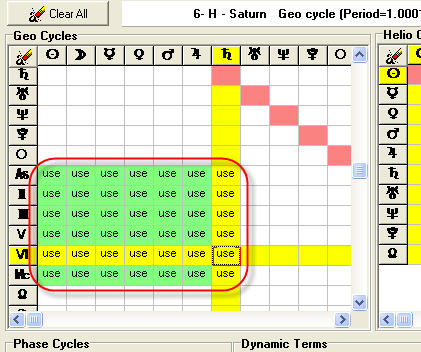
Parameters to Play: you can also consider these 4 cusps:
Also you can play with Dynamic Terms model:
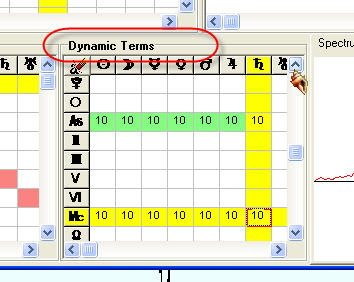
Parameters to Play: I recommend to play with Harmonics parameter:
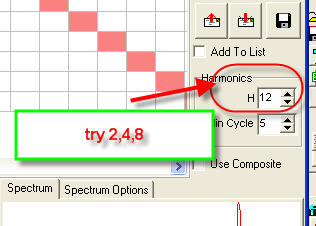
The bigger harmonics makes a projection line more detailed, though you may get too noisy curve.
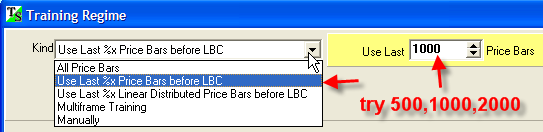
Now we are almost ready to cook the projection line. One more thing before doing it - I would like to recommend setting the training interval in this manner:
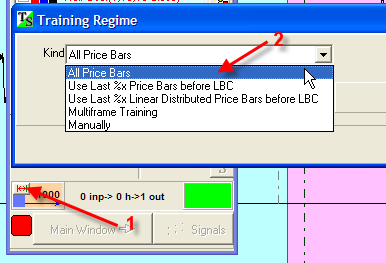
Thus we ask the Neural Net to use all available (before LBC) price history to generate the projection line. But this parameter strictly depends on the analyzed financial instrument. It would be better to try different training intervals and see when the model provides the better forecast:
Click "Training" button, and the program will start the process of making the projection line.
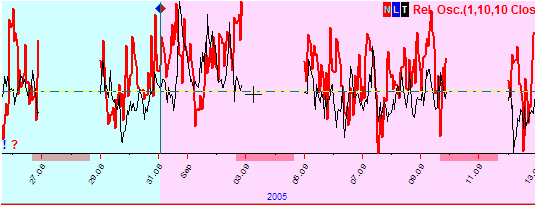
After 30.000 steps of training I got this projection line (red):
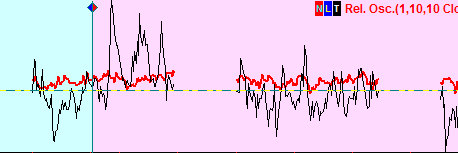
Actually it is difficult to compare these two lines (black price and red projection). I would like to recommend setting this option as "OFF":
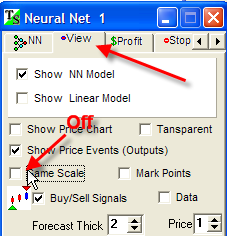
Now these lines look like this:
Try different variations to see how the projection line changes in respect to these parameters.
Sergey Tarassov.
April 1, 2006
January 13, 2009
Toronto, Canada