Cyclical analysis in essence in 33 pictures
Written by Sergey Tarassov
Introduction
In this article you will find the direction how to use all cyclical models that are present now in Timing Solution software. Right now the program allows to create practically all known cyclical models, starting from simple charting tools and ending with a special modification of the wavelet module. All cyclical models in Timing Solution were developed specifically for the stock market conditions.
You will find below the description of these models as well as some useful hints. However, what this article is actually about is the information theory and its application to the stock market analysis. Creating models and testing different ideas, we try to understand the language that His Majesty the Stock Market uses to communicate with us - and with the world. This is the focus point for us, this is what we always look for, no matter what models or techniques are discussed. In this regard, the general idea of the cyclical analysis is very simple (and you will find it below), while the amount of possible variations of this simple idea is huge; and all techniques presented in this article serve this very simple basic idea, though serve it differently. Practically all techniques shown below can be used for any financial instruments and for any time frames. Some modules here represent very popular techniques, while others (like Turbo Cycles module) have appeared as the result of very exhausting procedure of walk forward analysis.
The article is organized from simplest and obvious methods to the more complicated ones. We start with charting tools - visual tools to catch important market events. Then other methods appear, as a logical answer to the questions that appear after each move.
Let us start with the most used modules.
Step #1: very simple idea behind the cyclical analysis
We begin with very simple though very powerful approach: charting tools. They are designed to reveal cyclical phenomena in the price chart. By using charting tools (any of them!) we assume that there are cycles in the stock market, they just are there. Something is there that repeats itself again and again. If we do not believe that, we cannot use charting tools. (Please pay attention, this is our assumption only - based on our everyday life, our experience, education etc. - but still only assumption, not knowledge. No science here yet, just the art.)
So, having no intention or hidden agenda, I have downloaded the S&P 500 price chart, till the last price bar (December 2, 2011, because I have started writing this article on December 3). This is the piece of market information that we will work with.
Look at this chart:
I guess this chart shows clearly the core idea of the cyclical analysis. The major bottoms since April 2011 are separated by very close distances - 59, 54, 56 and 59 calendar days. Some kind of a repetition is there. This is the most important insight of the cyclical analysis - a presence of regular patterns. It is enough for us as so far; we can work with this simple idea without involving any complicated math.
Step #2: finding the best metrics - trading days or calendar days
Now, when we have our idea, we would like to take from it as much as possible. The distances between characteristic points of the price chart are close, though not exactly close. Can we do something with this idea? How we can improve it? First of all, let's look at the measure that we use. In the example above calendar days were used to calculate the distances between major bottoms. Let us use TRADING days instead of CALENDAR ones; here they are:
We have now 41, 37, 39 and again 37 trading days. The difference between the longest period (41 trading days) and the shortest one (37 trading days) is still big enough: 4 trading days or 10% of the longest period. Our cyclical picture is still unclear, not precise enough, and we have to look for something else.
Step #3: further improvement - welcome to astronomy
In example above we used some artificial (human made) measure to count the distance between major turning points. Neither calendar nor trading days are good enough. What if some other ways of measuring that distance could be more helpful? Where can we find them? There are natural measures, and we can find these natural measures among astronomical phenomena. To calculate the distance between major turning, we can use not calendar or trading days, we can use the most natural measure - the traveling path of the Sun; this is the very natural clock used from ancient times.
From the picture below you can easily see that the distance between major bottoms varies between 56.57 and 51.33 degrees:
We can only speculate on the differences of these distances, like assuming that the shorter length of the swing of 51.33 degrees is caused by a sharp drop in July-August. In many cases the cyclical picture that was blurry when we have used a human-made measure (calendar or trading days) turns to be very precise and contrasting when we apply the natural metrics - astronomical metrics. The Sun cycle is not the only one that we can use. The same manner we can try other ancient "clocks" to count the distance - such as the Moon phases or planetary phases, or more complicated phenomena.
Recommendations for Timing Solution users
You may use these counters as charting tools for any type of charts:
Also "Planetary Equidistant Lines" tool is recommended:
Step #4: waveform - what happens between turning points
So far we have restricted our research by turning points only. However, for real life trading we need to know more detailed information - to know how the stock market moves between the turning points. In other words, we would like to know not only the period of the cycle (the frequency of the repetitions), but the waveform that fits between those turning points. Assuming that such waveform exists, we may apply some charting tool based on it. In order to find a waveform that fits the best way to the stock price chart, there are several charting tools in Timing Solution. You can play with all of them to figure out how they fit your financial instrument.
For a start, try "Saw wave" charting tool. This is the simplest wave. It looks like this:
With this charting tool you can display the additional harmonics to your wave. This picture is an example; here the red chart represents a second harmonics:
Or you can use sinus waveform:
Try different waveforms till you find the one that fits your price chart well enough.
When you have mastered your skills with simple tools, it is the time to apply more advanced techniques. Try "Fourier string" charting tool. What you need to do is just dragging the mouse cursor from one turning point ("A") to another (turning point "B"). While you drag the mouse cursor through the screen, the program calculates fantastically fast the best fitting waveform that covers the interval between these two turning points. This is how it looks like on the screen:
As you see, all these charting tools are prolonged into the future; these are forecasting tools.
Recommendation for Timing Solution users
The list of available wave forms opens when you click "Wave" button:
In Options you can set the harmonics to be displayed:
When you apply Fourier string charting tools, try to play with the amount of overtones parameter to get more or less detailed waveform.
Step #5: superposition of several cycles
Easy cycle module allows to create more complicated cyclical models that deal with several cycles. Look how it works:
Dragging the mouse cursor you can draw a cycle overlaying the price chart, like this one:
While drawing the cycle, watch how it fits the price chart; it is simple. Then you can add another, faster, cycle to catch smaller oscillations in the stock market:
As soon as you do that, you can see the superposition of these two chosen cycles. In the same manner, you can add more cycles:
The advantage of this approach is obvious: you draw these cycles directly overlaying the price chart and using real scales, and you can see the results immediately. This tool can serve as visual express cyclical analysis. You can find more info about this module here: http://www.timingsolution.com/TS/Study/Easy_Cycle/
Step #5: spectrum analysis
Now let us move to more advanced technology. Though we can draw any cycles over the price chart, there still always is the question: what cycle should we choose? How can we find the cycle that fits the price chart the best way? The answer to this question is provided by Spectrum module. It is a very helpful tool for cyclical analysis; it allows to reveal the most influential cycles. It applies different cycles and selects the cycles that are the best fit to our price chart. See how it works:
When you run Spectrum module, you get this diagram:
The peaks on this diagram correspond to the periods of the strongest cycles that are presented inside the data. In our example the strongest cycles are 51, 95 and 150 days cycles.
To see how each one of these cycles works in time, simply click the mouse around this cycle (in our example, 51-days cycle is considered). You will see it together with the price chart:
You may increase the amount of overtones to see that same 51 days cycle with more details:
Now consider another strong cycle - 150 days cycle; simply click on the spectrogram around this cycle, and you immediately get one more cycle on the screen (a blue waveform):
Dragging these cycles to Main screen shows the superposition of these two cycles:
As it was mentioned earlier, to get the more detailed waveform the increase of the amount of overtones is recommended:
More info about this approach is this class: http://timingsolution.com/Doc/level_1/4.htm
Step #6: what metrics to use?
In the examples above, we used cycles calculated in calendar days. The same manner we can calculate cycles in trading days. This metrics is very useful for intraday data; the usage of cycles measured in bars is the only choice here as overnight gaps smash the whole picture. Calendar or trading days, we have met these metrics already (see Step #2). These are not the only ones that we can apply for cyclical analysis. We have already introduced cycles based on astronomical phenomena (see Step #3). Now, after we have learnt all the above and are able to make a superposition of several cycles, we can use ANY cycles, first to find the best fit to the available data, and then to generate a projection line. Timing Solution allows to do these things for astronomy based cycles as well. These cycles look totally different from the cycles based on calendar or trading days. Consider this cycle:
This cycle is based on Mercury phases. The cycle revealed here corresponds to the changes of Mercury phase on 104 degrees. As you see, this cycle is irregular, its irregularity is caused by Mercury's movement. And here is one of the major differences between astronomy based cycles (natural ones) and fixed number based cycles (human made, and it does not matter what is used there - calendar days, trading bars, etc.) Astronomy based cycles have irregularities that are part of what they are, part of their nature. Due to that, these cycles may fit better to the price chart, better than artificial cycles with any amount of their overtones. This is why I have such a special interest to astronomy based cycles. More about this kind of metrics can be found here: http://www.timingsolution.com/TS/Articles/metrics/index.htm
Recommendations for Timing Solution users
In Spectrum module, metrics is defined here:
Step #7: Turbo Cycles module - for busy people
Doing real time trading, we usually have no time for detailed analysis on the spot. Some homework - definitely, yes. Considering one, then another, and one more tool - definitely, no. The decisions should be made quickly. It is understandable that we would prefer to have some easy-to-use models. Turbo Cycles module has been developed with this purpose in mind. In spite the fact that a very complicated math is used to calculate, extract and sort the cycles and then create a projection line, this module works fantastically fast. It works in real time without any delay.
This how this module looks:
Here five of the most important cycles are revealed, and the projection line based on them is generated. Pay attention that cycles keep changing, there is no cycle that will be dominating for ever.
More about this module is here: http://www.timingsolution.com/TS/Study/Turbo_Cycles/
Step #8: Wavelets - cycles life
Let us look back at the path that we went through. We have assumed that the cycles exist. We have started with the search of some repetitions inside the market data. We looked for different metrics. Then we have tried to reconstruct cycles that described the past market activity - just to be able to use these cycles for projection line's generation. After that we have looked for a way to define the most active cycles - just to avoid a process of the direct application of any cycle that we can think of. We have learnt to use single cycles and to combine them together. We have played a lot with different cycles. And now we came to the next set of questions - regarding cycles themselves. We used to look at the cycles as something established once - and forever. But why cycles that are the strongest ones at one moment do not keep their strength forever? Why we have different sets of the strongest cycles for the same financial instrument at different time periods? Our next step is the answer that we have found to these questions.
Cycles do not live forever. They are born, live for some time and die. We used to call the strongest cycle that acts now as "dominant" cycle. The dominant cycle appears when other cycles are still active, then this cycle becomes stronger and works on the stock market field for some time and later it gives a room to another, new cycle or cycles. We can see it with Wavelet module. This module shows the cycle's life in dynamics. Look at this wavelet diagram:
The bright red spot there indicates that 117 days cycle is very active inside this time period. It has started to be active since mid of 2007 and disappears in the beginning of 2010. This diagram provides not only the information about what cycle is dominant at that period; it also gives us the information about the "age" of the analyzed cycle. The "old" age of the cycle (indicated by color) notifies that this cycle will stop working soon, and the models based on it have a strong chance to be not useful. As an opposite to that, we should keep our eye on the new born cycles - they give us a trading perspective.
This module in detailed is explained here: http://www.timingsolution.com/TS/Study/Classes/wavelet.htm
and here: http://www.timingsolution.com/TI/7/index.htm
Pattern recognition
This is another very powerful technique. This is not exactly cyclical analysis technique, though it is close to it. Here our focus is on patterns, not cycles. The program searches the most similar patterns in the past, even if they occurred only once (for cycles, the repetitions should be more frequent). An example of the pattern is this similarity of data in September 2010 and December 2011:
This technique is explained here: http://www.timingsolution.com/TS/Programs/pr/
Composite astro cycles
This is very important and very effective technique in Timing Solution. It is designed with the assumption that there are cycles in stock market activity and these cycles can be described the best as astronomy based cycles. This is a rather complicated module, so here we will not discuss it in details, only a short explanation will be provided.
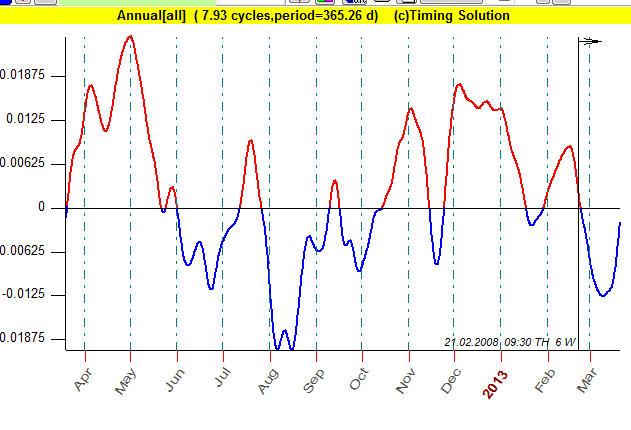
Generally speaking, here we consider together the astro cycle and the price chart. The most well known example is Annual cycle for Dow Jones Industrial Index; this is how it looks:
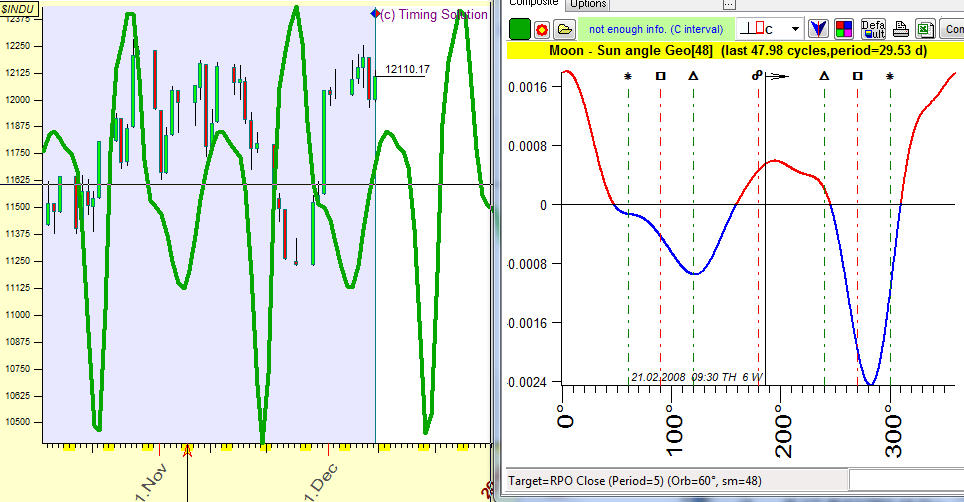
Exactly the same manner we can consider the Moon phase cycle (the left chart shows how it works in time, the right diagram is the composite diagram for the Moon phase cycle):
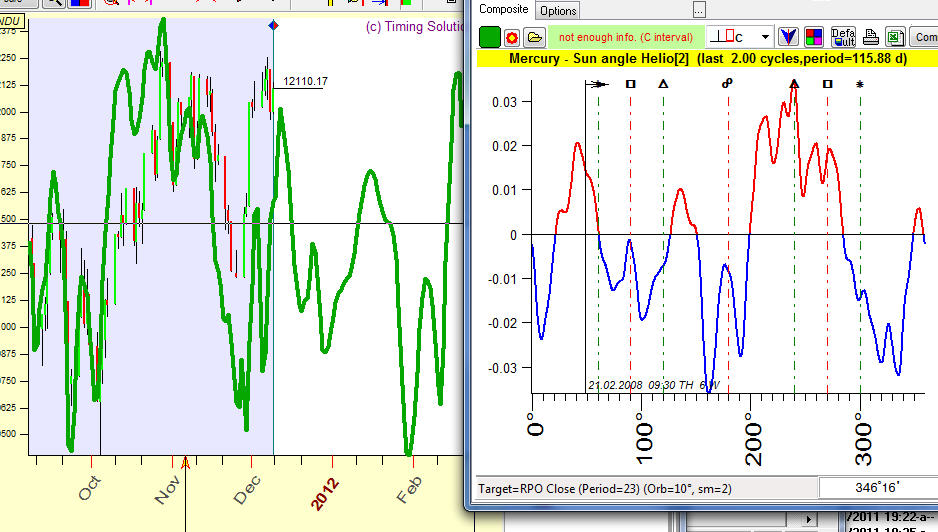
or Mercury phase cycle:
and many many other cycles.
This module helps to select the cycles that have some relation to the market activity and therefore can be useful to generate a reliable projection line.
Here you will find more info regarding this module: http://www.timingsolution.com/TS/Study/E/5.htm
New Horizons
Q Spectrum
In 2016 the new module has been developed that allows to reveal cycles from financial data. It is Q spectrum module: http://www.timingsolution.com/TI/16/index.htm
In this module we employed Walk Forward Analysis (WFA) for cyclical analysis, and this is important because WFA is now a standard in financial industry. This module is very popular among TS users. It also allows to reveal inverted cycles: http://www.timingsolution.com/TS/Articles/anti_information/
Two dimensional Time-Price Universe
Right now Timing Solution covers the most important cyclical models. These techniques use classical math methods, the newest techniques (like wavelet analysis and its variations), as well as our own technologies (like multiframe spectrum that deals well with choppy financial data). Among them there are some totally new experimental technologies. One of them is "Two dimensional Time-Price distance" charting tool.
The basic idea of this tool is incorporating a two-dimensional wave. We used to analyze ONE dimensional waves - the cyclic wave that exists in TIME Universe. Here we try to apply two dimensional wave, this wave propagates through two dimensional TIME and PRICE domain.
Similar to the waves produced by the stone that is dropped into the water:

we can create the same waves on Time-Price chart:
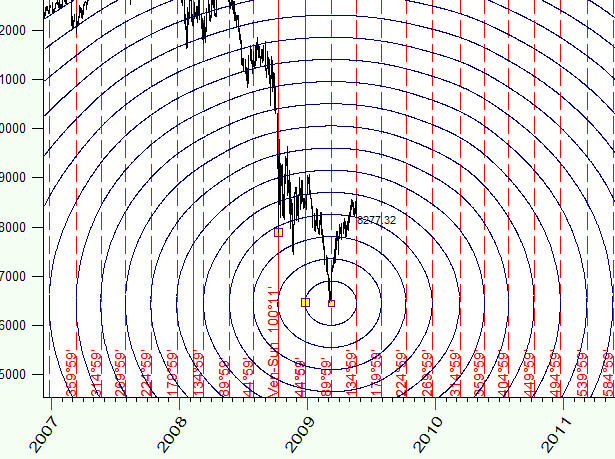
These waves can form some patterns (like interference phenomena):
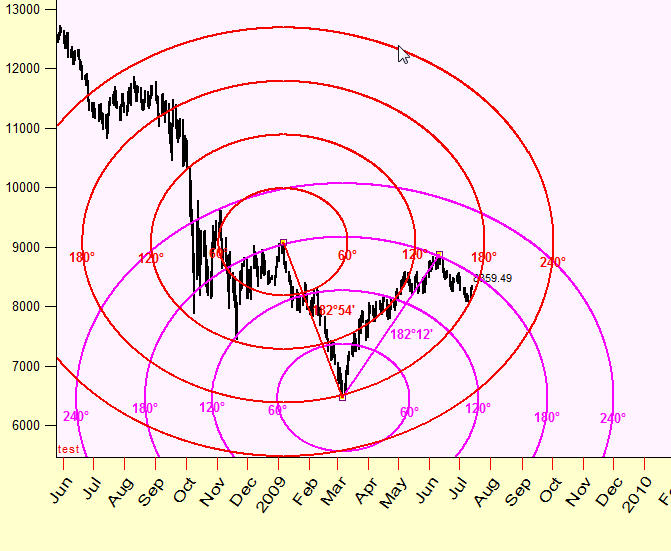
The next question is finding the proper topology of this TIME-PRICE Universe. This is important, for example the waves can look this way:
This techniques is explained here: http://www.timingsolution.com/TS/Articles/ptd/
But once again, this is a totally experimental technique. We need several years to collect some info to figure out how this approach works :) or does not work :(
December 12, 2011
January 15, 2017
Toronto, Canada